Help & Documentation
  • Home
  • Sign In
  • Contact Us
  • Home
  • Sign In
  • Contact Us

Gold Front Month up to 1957.2700

/Futures Technical Analysis - TD/Gold Front Month up to 1957.2700

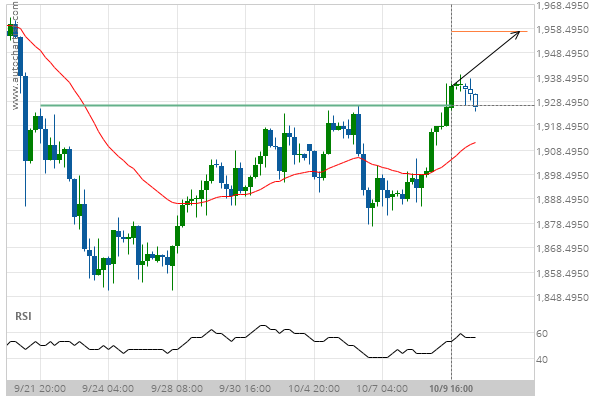
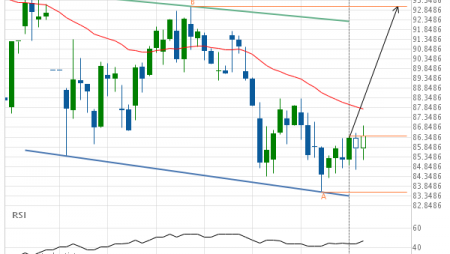
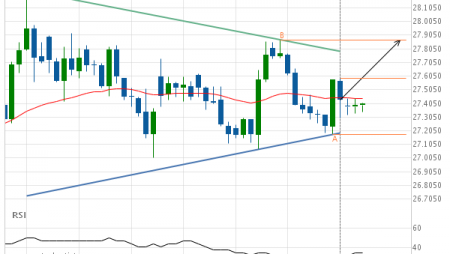
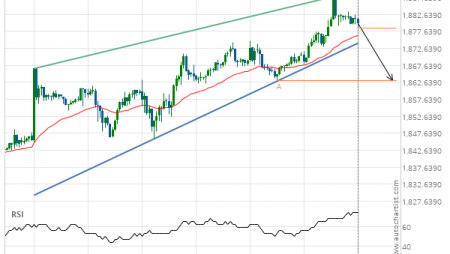
Gold Front Month up to 1957.2700

Posted on October 12, 2020 by Autochartist wrote in Futures Technical Analysis - TD.

Broke through Resistance level of 1927.0000 at 09-Oct-2020 16:00 EDT

Tags: GC
0 Likes
302 Views

You may also like

Corn up to 458.2500
Corn up to 458.2500
July 4, 2019
Corn down to 320.0000
July 29, 2020
Corn down to 386.2507
December 18, 2019

Comments are closed.

10 year T-Note down to 138.7188 Soybean Oil up to 34.9230

Futures Technical Analysis – TD

Light Sweet Crude Oil Front Month up to 67.9800

March 9, 2021 11:17 am | By Autochartist

Rising Wedge identified at 09-Mar-2021 05:00 EST. This pattern is... Read more →

Feeder Cattle Front Month down to 137.2250

March 9, 2021 11:17 am | By Autochartist

Channel Down identified at 08-Mar-2021 14:00 EST. This pattern is... Read more →

Soybean Oil up to 53.2300

March 9, 2021 11:17 am | By Autochartist

Channel Up identified at 09-Mar-2021 04:30 EST. This pattern is... Read more →

Silver Front Month up to 26.5600

March 9, 2021 11:17 am | By Autochartist

Approaching Resistance level of 26.5600 identified at 09-Mar-2021 04:00 EST Read more →

10 year T-Note up to 133.1644

March 9, 2021 11:17 am | By Autochartist

Falling Wedge has broken through the resistance line at 09-Mar-2021... Read more →

  • About Us
  • Privacy Policy
  • Disclaimer
  • Terms and Conditions
  • Get started for FREE
  • Contact Us
Copyright © 2020 Autochartist.com. All rights reserved.
This site uses cookies: Find out more.