Help & Documentation
  • Home
  • Sign In
  • Contact Us
  • Home
  • Sign In
  • Contact Us

Gold Front Month up to 1925.5000

/Futures Technical Analysis - TD/Gold Front Month up to 1925.5000

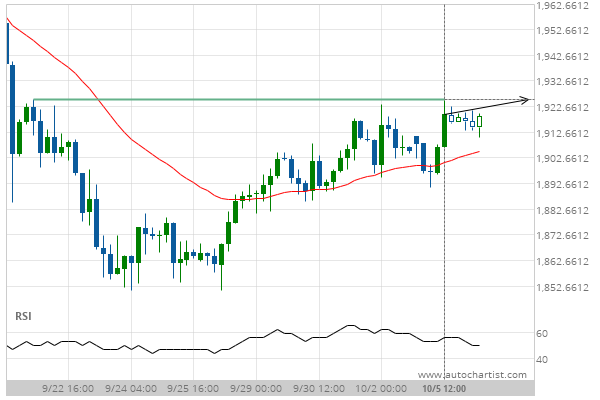
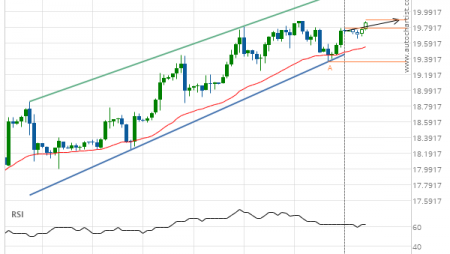
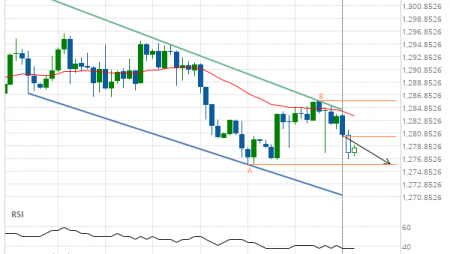
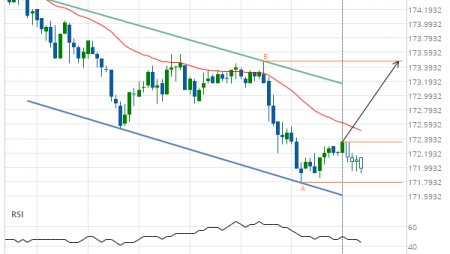
Gold Front Month up to 1925.5000

Posted on October 6, 2020 by Autochartist wrote in Futures Technical Analysis - TD.

Approaching Resistance level of 1925.5000 identified at 05-Oct-2020 12:00 EDT

Tags: GC
0 Likes
317 Views

You may also like

Light Sweet Crude Oil Front Month down to 43.3200
March 2, 2020
Corn up to 406.7500
Corn up to 406.7500
August 6, 2019
Soybeans up to 895.5000
September 30, 2019

Comments are closed.

E-mini S&P 500 down to 3300.2500 Trade of the Day: EUR/CAD

Futures Technical Analysis – TD

Light Sweet Crude Oil Front Month up to 67.9800

March 9, 2021 11:17 am | By Autochartist

Rising Wedge identified at 09-Mar-2021 05:00 EST. This pattern is... Read more →

Feeder Cattle Front Month down to 137.2250

March 9, 2021 11:17 am | By Autochartist

Channel Down identified at 08-Mar-2021 14:00 EST. This pattern is... Read more →

Soybean Oil up to 53.2300

March 9, 2021 11:17 am | By Autochartist

Channel Up identified at 09-Mar-2021 04:30 EST. This pattern is... Read more →

Silver Front Month up to 26.5600

March 9, 2021 11:17 am | By Autochartist

Approaching Resistance level of 26.5600 identified at 09-Mar-2021 04:00 EST Read more →

10 year T-Note up to 133.1644

March 9, 2021 11:17 am | By Autochartist

Falling Wedge has broken through the resistance line at 09-Mar-2021... Read more →

  • About Us
  • Privacy Policy
  • Disclaimer
  • Terms and Conditions
  • Get started for FREE
  • Contact Us
Copyright © 2020 Autochartist.com. All rights reserved.
This site uses cookies: Find out more.