Help & Documentation
  • Home
  • Sign In
  • Contact Us
  • Home
  • Sign In
  • Contact Us

Gold Front Month up to 1854.2000

/Futures Technical Analysis - TD/Gold Front Month up to 1854.2000

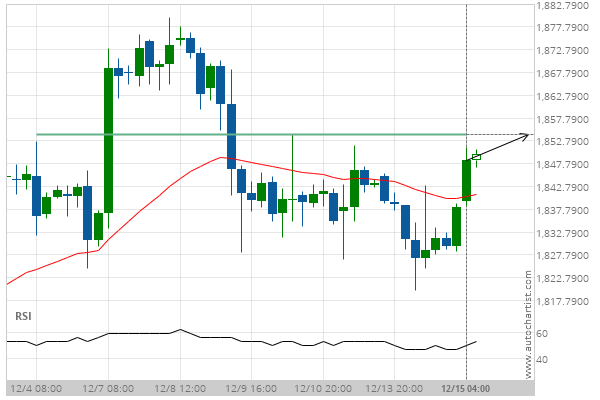
Gold Front Month up to 1854.2000

Posted on December 15, 2020 by admin wrote in Futures Technical Analysis - TD.

Approaching Resistance level of 1854.2000 identified at 15-Dec-2020 04:00 EST

Tags: GC
0 Likes
23 Views

You may also like

Soybean Oil down to 28.7800
April 9, 2019
Silver Front Month down to 15.2626
April 15, 2020
Light Sweet Crude Oil Front Month down to 22.9400
May 8, 2020

Comments are closed.

US T-Bond up to 174.2813 AUD/USD excessive bearish movement

Futures Technical Analysis – TD

Soybean Meal up to 471.4000

January 18, 2021 11:16 am | By admin

Channel Up identified at 15-Jan-2021 12:00 EST. This pattern is... Read more →

Soybeans down to 1403.0000

January 18, 2021 11:16 am | By admin

Approaching Support level of 1403.0000 identified at 15-Jan-2021 12:30 EST Read more →

Gold Front Month down to 1800.8000

January 18, 2021 11:16 am | By admin

Channel Down identified at 18-Jan-2021 05:00 EST. This pattern is... Read more →

US T-Bond down to 168.0313

January 18, 2021 11:16 am | By admin

Triangle identified at 18-Jan-2021 05:00 EST. This pattern is still... Read more →

Corn down to 524.1489

January 18, 2021 11:16 am | By admin

Triangle has broken through the support line at 15-Jan-2021 09:00... Read more →

  • About Us
  • Privacy Policy
  • Disclaimer
  • Terms and Conditions
  • Get started for FREE
  • Contact Us
Copyright © 2020 Autochartist.com. All rights reserved.
This site uses cookies: Find out more.