Help & Documentation
  • Home
  • Sign In
  • Contact Us
  • Home
  • Sign In
  • Contact Us

Gold Front Month up to 1815.0000

/Futures Technical Analysis - TD/Gold Front Month up to 1815.0000

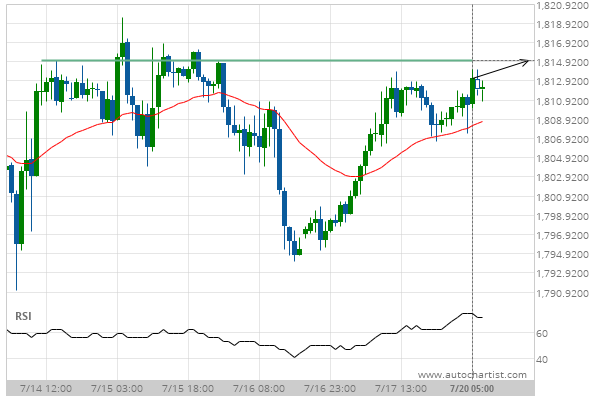
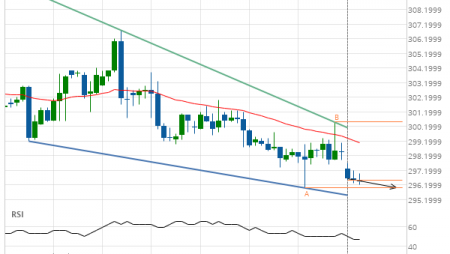
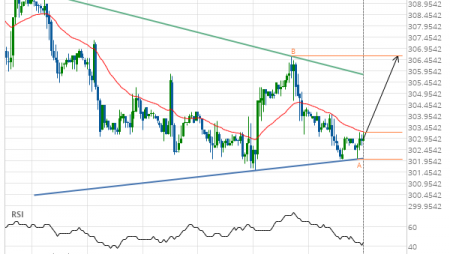
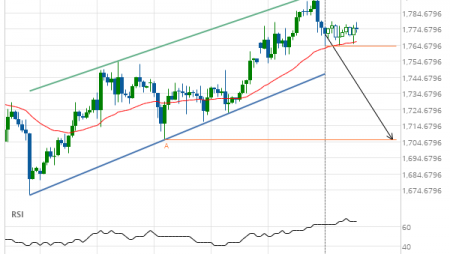
Gold Front Month up to 1815.0000

Posted on July 20, 2020 by Autochartist wrote in Futures Technical Analysis - TD.

Approaching Resistance level of 1815.0000 identified at 20-Jul-2020 05:00 EDT

Tags: GC
0 Likes
496 Views

You may also like

Corn down to 376.8330
February 3, 2020
Gold Front Month up to 1472.5200
November 13, 2019
Light Sweet Crude Oil Front Month down to 56.0000
February 19, 2019

Comments are closed.

10 year T-Note up to 139.5625 Corn down to 326.7500

Futures Technical Analysis – TD

Light Sweet Crude Oil Front Month up to 67.9800

March 9, 2021 11:17 am | By Autochartist

Rising Wedge identified at 09-Mar-2021 05:00 EST. This pattern is... Read more →

Feeder Cattle Front Month down to 137.2250

March 9, 2021 11:17 am | By Autochartist

Channel Down identified at 08-Mar-2021 14:00 EST. This pattern is... Read more →

Soybean Oil up to 53.2300

March 9, 2021 11:17 am | By Autochartist

Channel Up identified at 09-Mar-2021 04:30 EST. This pattern is... Read more →

Silver Front Month up to 26.5600

March 9, 2021 11:17 am | By Autochartist

Approaching Resistance level of 26.5600 identified at 09-Mar-2021 04:00 EST Read more →

10 year T-Note up to 133.1644

March 9, 2021 11:17 am | By Autochartist

Falling Wedge has broken through the resistance line at 09-Mar-2021... Read more →

  • About Us
  • Privacy Policy
  • Disclaimer
  • Terms and Conditions
  • Get started for FREE
  • Contact Us
Copyright © 2022 Autochartist.com. All rights reserved.
This site uses cookies: Find out more.