Help & Documentation
  • Home
  • Sign In
  • Contact Us
  • Home
  • Sign In
  • Contact Us

Gold Front Month up to 1742.6000

/Futures Technical Analysis - TD/Gold Front Month up to 1742.6000

Gold Front Month up to 1742.6000

Posted on April 9, 2020 by Autochartist wrote in Futures Technical Analysis - TD.

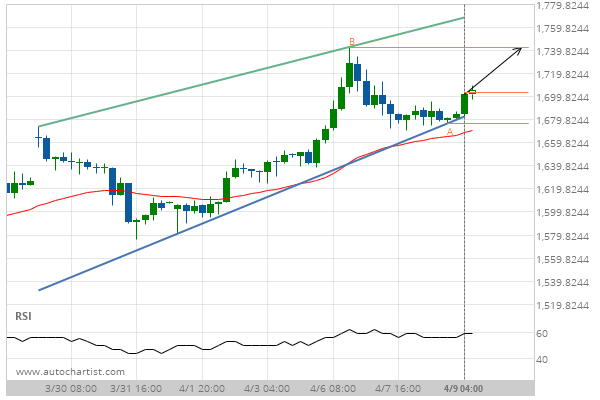
Rising Wedge identified at 09-Apr-2020 04:00 EDT. This pattern is still in the process of forming. Possible bullish price movement towards the resistance 1742.6000 within the next 3 days.

Tags: COMEX, GC
0 Likes
570 Views

You may also like

Soybeans down to 821.0000
March 17, 2020
Soybeans down to 871.1500
July 9, 2019
Corn down to 358.0000
September 15, 2020

Comments are closed.

10 year T-Note up to 138.3906 E-mini S&P 500 down to 2629.0000

Futures Technical Analysis – TD

Light Sweet Crude Oil Front Month up to 67.9800

March 9, 2021 11:17 am | By Autochartist

Rising Wedge identified at 09-Mar-2021 05:00 EST. This pattern is... Read more →

Feeder Cattle Front Month down to 137.2250

March 9, 2021 11:17 am | By Autochartist

Channel Down identified at 08-Mar-2021 14:00 EST. This pattern is... Read more →

Soybean Oil up to 53.2300

March 9, 2021 11:17 am | By Autochartist

Channel Up identified at 09-Mar-2021 04:30 EST. This pattern is... Read more →

Silver Front Month up to 26.5600

March 9, 2021 11:17 am | By Autochartist

Approaching Resistance level of 26.5600 identified at 09-Mar-2021 04:00 EST Read more →

10 year T-Note up to 133.1644

March 9, 2021 11:17 am | By Autochartist

Falling Wedge has broken through the resistance line at 09-Mar-2021... Read more →

  • About Us
  • Privacy Policy
  • Disclaimer
  • Terms and Conditions
  • Get started for FREE
  • Contact Us
Copyright © 2022 Autochartist.com. All rights reserved.
This site uses cookies: Find out more.