Help & Documentation
  • Home
  • Sign In
  • Contact Us
  • Home
  • Sign In
  • Contact Us

Gold Front Month up to 1494.6200

/Futures Technical Analysis - TD/Gold Front Month up to 1494.6200

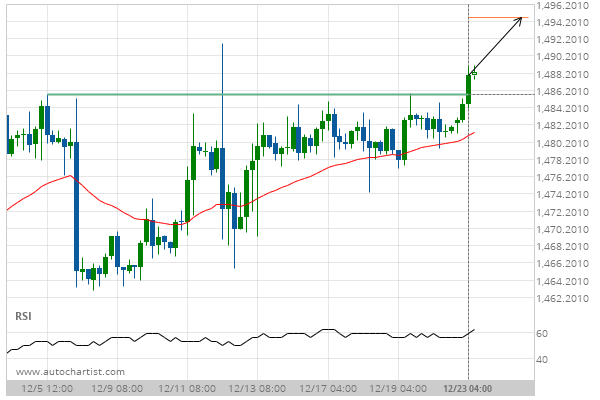
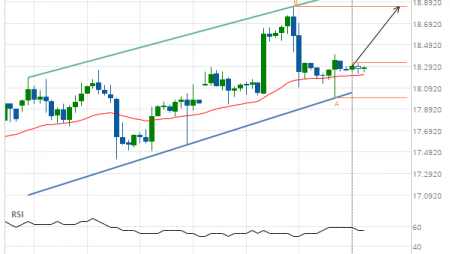
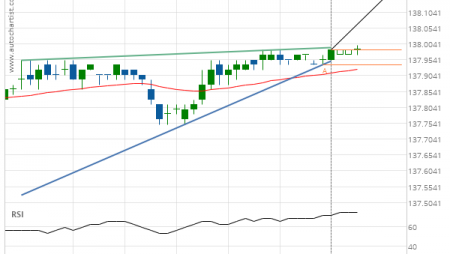
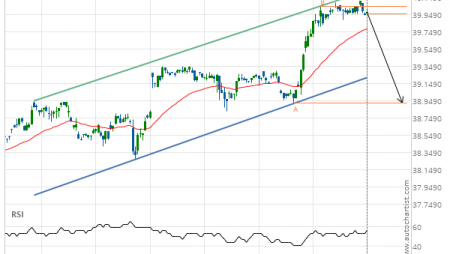
Gold Front Month up to 1494.6200

Posted on December 23, 2019 by Autochartist wrote in Futures Technical Analysis - TD.

Broke through Resistance level of 1485.7000 at 23-Dec-2019 04:00 EST

Tags: GC
0 Likes
596 Views

You may also like

Gold Front Month up to 1525.8000
October 4, 2019
Gold Front Month up to 1523.8000
September 10, 2019
Light Sweet Crude Oil Front Month up to 57.8100
February 25, 2019

Comments are closed.

Silver Front Month down to 17.2300 Soybean Oil excessive bearish movement

Futures Technical Analysis – TD

Light Sweet Crude Oil Front Month up to 67.9800

March 9, 2021 11:17 am | By Autochartist

Rising Wedge identified at 09-Mar-2021 05:00 EST. This pattern is... Read more →

Feeder Cattle Front Month down to 137.2250

March 9, 2021 11:17 am | By Autochartist

Channel Down identified at 08-Mar-2021 14:00 EST. This pattern is... Read more →

Soybean Oil up to 53.2300

March 9, 2021 11:17 am | By Autochartist

Channel Up identified at 09-Mar-2021 04:30 EST. This pattern is... Read more →

Silver Front Month up to 26.5600

March 9, 2021 11:17 am | By Autochartist

Approaching Resistance level of 26.5600 identified at 09-Mar-2021 04:00 EST Read more →

10 year T-Note up to 133.1644

March 9, 2021 11:17 am | By Autochartist

Falling Wedge has broken through the resistance line at 09-Mar-2021... Read more →

  • About Us
  • Privacy Policy
  • Disclaimer
  • Terms and Conditions
  • Get started for FREE
  • Contact Us
Copyright © 2022 Autochartist.com. All rights reserved.
This site uses cookies: Find out more.