Help & Documentation
  • Home
  • Sign In
  • Contact Us
  • Home
  • Sign In
  • Contact Us

Gold Front Month excessive bearish movement

/Futures Statistical Analysis - TD/Gold Front Month excessive bearish movement

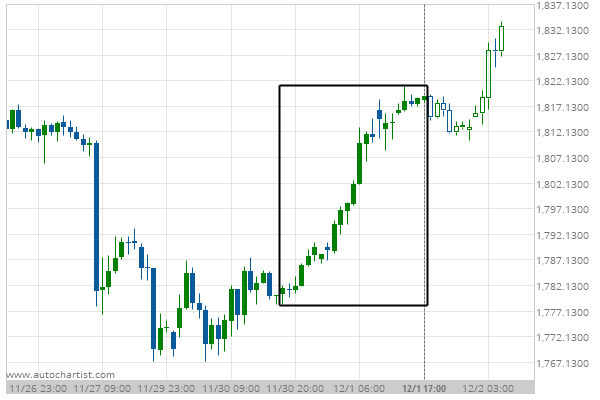
Gold Front Month excessive bearish movement

Posted on December 2, 2020 by Autochartist wrote in Futures Statistical Analysis - TD.

Gold Front Month experienced a 2.1% bullish movement in the last 23 hours.

Tags: Big Movement, GC
0 Likes
257 Views

You may also like

KC HRW Wheat excessive bearish movement
May 24, 2019
Soybean Oil excessive bearish movement
December 24, 2020
Lean Hogs excessive bullish movement
June 19, 2020

Comments are closed.

Caterpillar Inc. (CAT) down to 170.82 Silver Front Month excessive bearish movement

Futures Statistical Analysis – TD

Soybean Oil excessive bearish movement

March 9, 2021 11:16 am | By Autochartist

Soybean Oil experienced a 19.04% bullish movement in the last... Read more →

Corn excessive bearish movement

March 8, 2021 11:19 am | By Autochartist

Corn experienced a 4.61% bullish movement in the last 73... Read more →

Gold Front Month excessive bearish movement

March 8, 2021 11:19 am | By Autochartist

Gold Front Month experienced a 6.29% bearish movement in the... Read more →

Light Sweet Crude Oil Front Month excessive bearish movement

March 8, 2021 11:19 am | By Autochartist

Light Sweet Crude Oil Front Month experienced a 8.6% bullish... Read more →

10 year T-Note excessive bearish movement

March 8, 2021 11:19 am | By Autochartist

10 year T-Note experienced a 3.4% bearish movement in the... Read more →

  • About Us
  • Privacy Policy
  • Disclaimer
  • Terms and Conditions
  • Get started for FREE
  • Contact Us
Copyright © 2020 Autochartist.com. All rights reserved.
This site uses cookies: Find out more.