Help & Documentation
  • Home
  • Sign In
  • Contact Us
  • Home
  • Sign In
  • Contact Us

Gold Front Month down to 1690.9000

/Futures Technical Analysis - TD/Gold Front Month down to 1690.9000

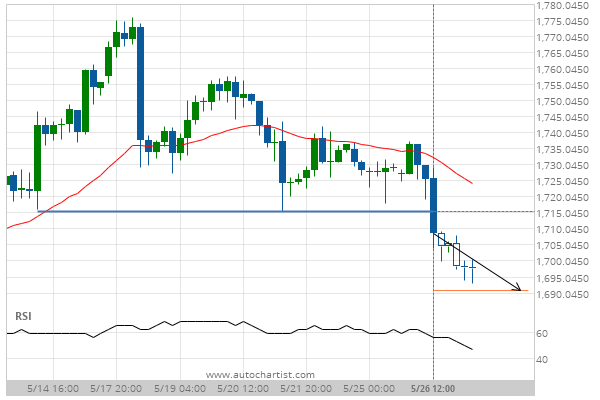
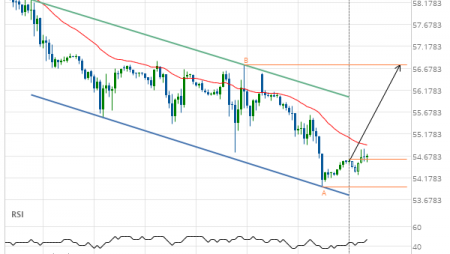
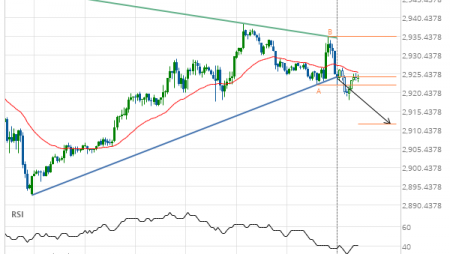
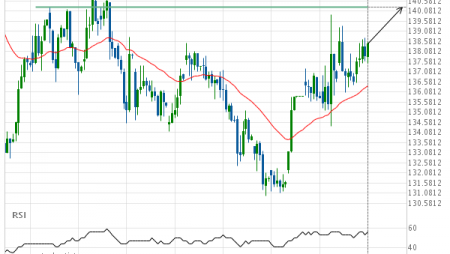
Gold Front Month down to 1690.9000

Posted on May 27, 2020 by admin wrote in Futures Technical Analysis - TD.

Broke through Support level of 1715.3000 at 26-May-2020 12:00 EDT

Tags: GC
0 Likes
165 Views

You may also like

Soybean Oil down to 27.9500
June 10, 2020
Corn up to 381.5000
Corn up to 381.5000
February 14, 2020
10 year T-Note up to 139.7031
July 15, 2020

Comments are closed.

US T-Bond down to 178.0281 E-mini S&P 500 up to 3019.7500

Futures Technical Analysis – TD

Soybean Oil up to 43.4600

January 22, 2021 11:15 am | By admin

Channel Up identified at 22-Jan-2021 02:30 EST. This pattern is... Read more →

Lean Hogs up to 72.0000

January 22, 2021 11:15 am | By admin

Channel Up identified at 20-Jan-2021 16:00 EST. This pattern is... Read more →

Light Sweet Crude Oil Front Month down to 51.1900

January 22, 2021 11:15 am | By admin

Broke through Support level of 52.1400 at 22-Jan-2021 06:00 EST Read more →

Gold Front Month down to 1831.8000

January 22, 2021 11:15 am | By admin

Broke through Support level of 1854.8000 at 22-Jan-2021 06:00 EST Read more →

US T-Bond down to 167.6322

January 22, 2021 11:15 am | By admin

Triangle has broken through the support line at 21-Jan-2021 12:00... Read more →

  • About Us
  • Privacy Policy
  • Disclaimer
  • Terms and Conditions
  • Get started for FREE
  • Contact Us
Copyright © 2020 Autochartist.com. All rights reserved.
This site uses cookies: Find out more.