General Electric Co. (GE) up to 11.60
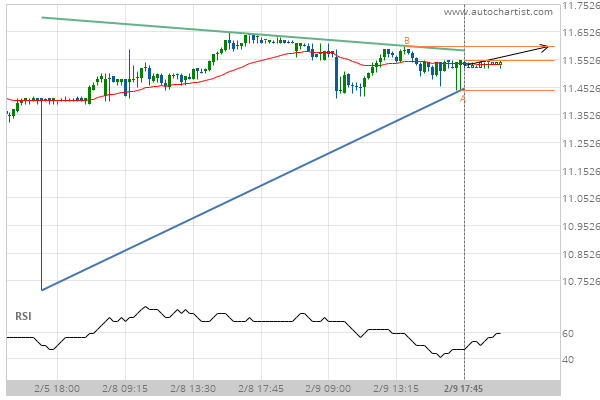
Triangle identified at 09-Feb-2021 17:45 EST. This pattern is still in the process of forming. Possible bullish price movement towards the resistance 11.60 within the next 7 hours.
Triangle identified at 09-Feb-2021 17:45 EST. This pattern is still in the process of forming. Possible bullish price movement towards the resistance 11.60 within the next 7 hours.