General Electric Co. (GE) down to 6.58
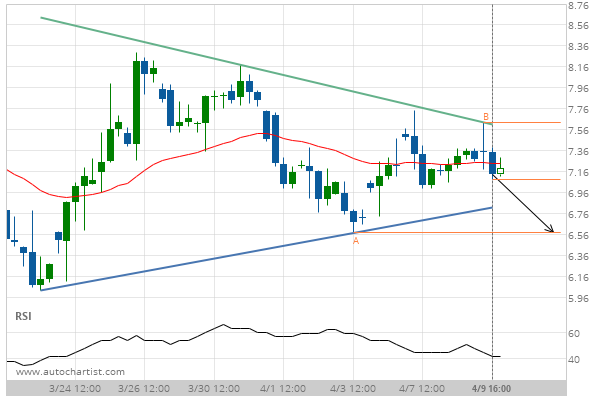
Triangle identified at 09-Apr-2020 16:00 EDT. This pattern is still in the process of forming. Possible bearish price movement towards the support 6.58 within the next 3 days.
Triangle identified at 09-Apr-2020 16:00 EDT. This pattern is still in the process of forming. Possible bearish price movement towards the support 6.58 within the next 3 days.