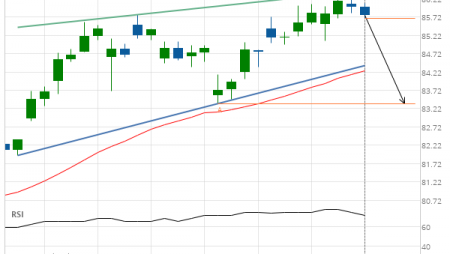
General Electric Co. (GE) down to 6.48
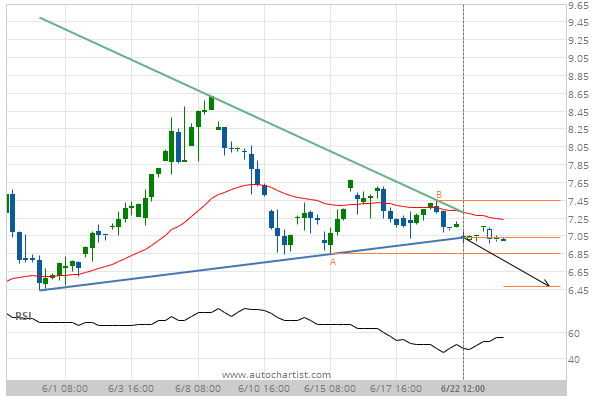
Triangle has broken through the support line at 22-Jun-2020 12:00 EDT. Possible bearish price movement forecast for the next 2 days towards 6.48.
Triangle has broken through the support line at 22-Jun-2020 12:00 EDT. Possible bearish price movement forecast for the next 2 days towards 6.48.