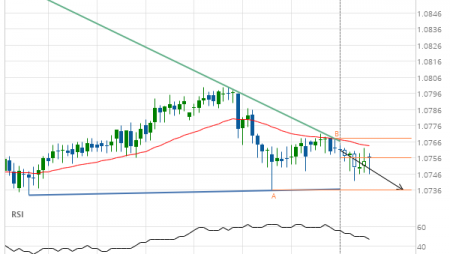
GBP/USD up to 1.2869
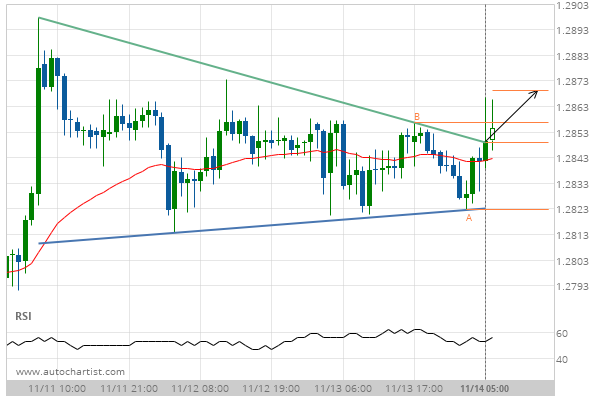
Triangle has broken through the resistance line at 14-Nov-2019 05:00 EST. Possible bullish price movement forecast for the next 21 hours towards 1.2869.
Triangle has broken through the resistance line at 14-Nov-2019 05:00 EST. Possible bullish price movement forecast for the next 21 hours towards 1.2869.