Help & Documentation
  • Home
  • Sign In
  • Contact Us
  • Home
  • Sign In
  • Contact Us

GBP/USD down to 1.3303

/Forex Technical Analysis - TD/GBP/USD down to 1.3303

GBP/USD down to 1.3303

Posted on November 26, 2020 by admin wrote in Forex Technical Analysis - TD.

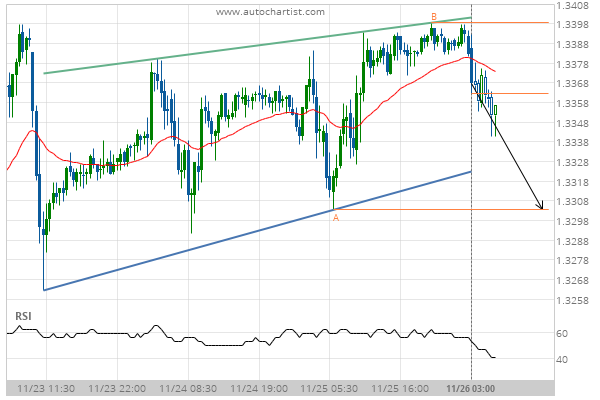
Rising Wedge identified at 26-Nov-2020 03:00 EST. This pattern is still in the process of forming. Possible bearish price movement towards the support 1.3303 within the next 18 hours.

Tags: GBPUSD
0 Likes
41 Views

You may also like

GBP/JPY up to 137.3049
June 20, 2019
NZD/JPY down to 68.5550
September 10, 2019
USD/CAD up to 1.3208
November 6, 2019

Comments are closed.

General Electric Co. (GE) excessive bearish movement Goldman Sachs Group Inc. (GS) excessive bearish movement

Forex Technical Analysis – TD

USD/JPY up to 103.9250

January 27, 2021 11:19 am | By admin

Approaching Resistance level of 103.9250 identified at 27-Jan-2021 05:00 EST Read more →

AUD/USD down to 0.7666

January 27, 2021 11:19 am | By admin

Triangle identified at 27-Jan-2021 04:00 EST. This pattern is still... Read more →

EUR/USD up to 1.2190

January 27, 2021 11:19 am | By admin

Triangle identified at 26-Jan-2021 12:00 EST. This pattern is still... Read more →

GBP/USD down to 1.3698

January 27, 2021 11:19 am | By admin

Rising Wedge has broken through the support line at 27-Jan-2021... Read more →

XAU/USD down to 1832.7000

January 27, 2021 11:19 am | By admin

Approaching Support level of 1832.7000 identified at 26-Jan-2021 21:00 EST Read more →

  • About Us
  • Privacy Policy
  • Disclaimer
  • Terms and Conditions
  • Get started for FREE
  • Contact Us
Copyright © 2020 Autochartist.com. All rights reserved.
This site uses cookies: Find out more.