Help & Documentation
  • Home
  • Sign In
  • Contact Us
  • Home
  • Sign In
  • Contact Us

GBP/USD down to 1.2973

/Forex Technical Analysis - TD/GBP/USD down to 1.2973

GBP/USD down to 1.2973

Posted on October 18, 2018 by admin wrote in Forex Technical Analysis - TD.

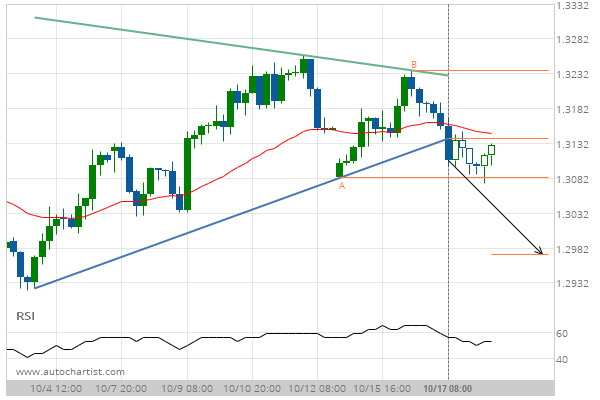
Triangle has broken through the support line at 17-Oct-2018 08:00 EDT. Possible bearish price movement forecast for the next 3 days towards 1.2973.

Tags: GBPUSD
0 Likes
134 Views

You may also like

AUD/USD down to 0.7173
January 14, 2019
EUR/CHF down to 1.1332
November 14, 2018
EUR/USD down to 1.1553
October 12, 2018

Comments are closed.

Nike Inc. Cl B (NKE) down to 73.90 General Electric Co. (GE) up to 13.78

Forex Technical Analysis – TD

GBP/CAD up to 1.7296

February 21, 2019 11:15 am | By admin

Ascending Triangle identified at 21-Feb-2019 04:00 EST. This pattern is... Read more →

NZD/USD down to 0.6789

February 21, 2019 11:15 am | By admin

Descending Triangle has broken through the support line at 21-Feb-2019... Read more →

AUD/USD down to 0.7081

February 21, 2019 11:15 am | By admin

Channel Up has broken through the support line at 21-Feb-2019... Read more →

EUR/USD down to 1.1316

February 21, 2019 11:15 am | By admin

Channel Down identified at 21-Feb-2019 05:30 EST. This pattern is... Read more →

GBP/USD up to 1.3109

February 21, 2019 11:15 am | By admin

Rising Wedge identified at 21-Feb-2019 03:30 EST. This pattern is... Read more →

  • About Us
  • Privacy Policy
  • Disclaimer
  • Terms and Conditions
  • Get started for FREE
  • Contact Us
Copyright © 2018 Autochartist.com. All rights reserved.
Register

Sign-up


I accept the Privacy Policy, Disclaimer and Conditions of this service

* = Required Field

This site uses cookies: Find out more.