Help & Documentation
  • Home
  • Sign In
  • Contact Us
  • Home
  • Sign In
  • Contact Us

GBP/NZD down to 1.9915

/Forex Technical Analysis - TD/GBP/NZD down to 1.9915

GBP/NZD down to 1.9915

Posted on September 12, 2018 by Autochartist wrote in Forex Technical Analysis - TD.

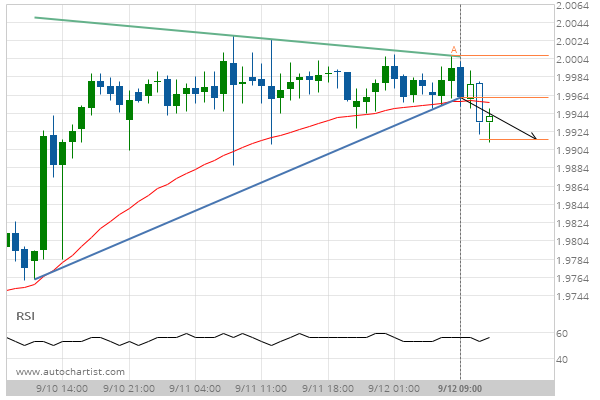
Triangle has broken through the support line at 12-Sep-2018 09:00 UTC. Possible bearish price movement forecast for the next 12 hours towards 1.9915.

Tags: FOREX, GBPNZD
0 Likes
1199 Views

You may also like

XAG/USD up to 17.8508
August 26, 2019
USD/CHF down to 0.9077
November 23, 2020
USD/CAD down to 1.3137
December 23, 2019

Comments are closed.

10 year T-Note down to 119.2813 USD/JPY up to 111.6350

Forex Technical Analysis – TD

EUR/CHF up to 1.1152

March 9, 2021 11:15 am | By Autochartist

Rising Wedge identified at 09-Mar-2021 00:00 EST. This pattern is... Read more →

EUR/JPY up to 129.6360

March 9, 2021 11:15 am | By Autochartist

Triangle identified at 08-Mar-2021 20:00 EST. This pattern is still... Read more →

NZD/USD up to 0.7188

March 9, 2021 11:15 am | By Autochartist

Broke through Resistance level of 0.7153 at 09-Mar-2021 04:00 EST Read more →

USD/JPY down to 108.1606

March 9, 2021 11:15 am | By Autochartist

Rising Wedge has broken through the support line at 09-Mar-2021... Read more →

USD/CHF down to 0.9284

March 9, 2021 11:15 am | By Autochartist

Approaching Support level of 0.9284 identified at 09-Mar-2021 05:15 EST Read more →

  • About Us
  • Privacy Policy
  • Disclaimer
  • Terms and Conditions
  • Get started for FREE
  • Contact Us
Copyright © 2022 Autochartist.com. All rights reserved.
This site uses cookies: Find out more.