Help & Documentation
  • Home
  • Sign In
  • Contact Us
  • Home
  • Sign In
  • Contact Us

GBP/JPY up to 146.5703

/Forex Technical Analysis - TD/GBP/JPY up to 146.5703

GBP/JPY up to 146.5703

Posted on November 26, 2018 by Autochartist wrote in Forex Technical Analysis - TD.

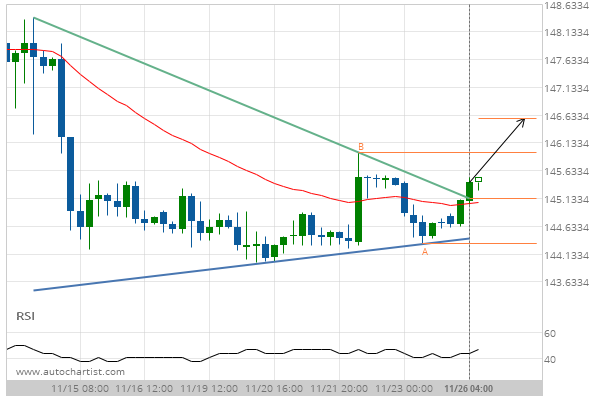
Triangle has broken through the resistance line at 26-Nov-2018 04:00 EST. Possible bullish price movement forecast for the next 3 days towards 146.5703.

Tags: GBPJPY
0 Likes
822 Views

You may also like

NZD/USD down to 0.5949
May 15, 2020
USD/CHF down to 0.9703
May 25, 2020
AUD/USD up to 0.7742
January 5, 2021

Comments are closed.

Daily Forex Update: USD/JPY EUR/CHF up to 1.1352

Forex Technical Analysis – TD

EUR/CHF up to 1.1152

March 9, 2021 11:15 am | By Autochartist

Rising Wedge identified at 09-Mar-2021 00:00 EST. This pattern is... Read more →

EUR/JPY up to 129.6360

March 9, 2021 11:15 am | By Autochartist

Triangle identified at 08-Mar-2021 20:00 EST. This pattern is still... Read more →

NZD/USD up to 0.7188

March 9, 2021 11:15 am | By Autochartist

Broke through Resistance level of 0.7153 at 09-Mar-2021 04:00 EST Read more →

USD/JPY down to 108.1606

March 9, 2021 11:15 am | By Autochartist

Rising Wedge has broken through the support line at 09-Mar-2021... Read more →

USD/CHF down to 0.9284

March 9, 2021 11:15 am | By Autochartist

Approaching Support level of 0.9284 identified at 09-Mar-2021 05:15 EST Read more →

  • About Us
  • Privacy Policy
  • Disclaimer
  • Terms and Conditions
  • Get started for FREE
  • Contact Us
Copyright © 2020 Autochartist.com. All rights reserved.
This site uses cookies: Find out more.