Help & Documentation
  • Home
  • Sign In
  • Contact Us
  • Home
  • Sign In
  • Contact Us

GBP/JPY up to 142.5933

/Forex Technical Analysis - TD/GBP/JPY up to 142.5933

GBP/JPY up to 142.5933

Posted on February 11, 2019 by Autochartist wrote in Forex Technical Analysis - TD.

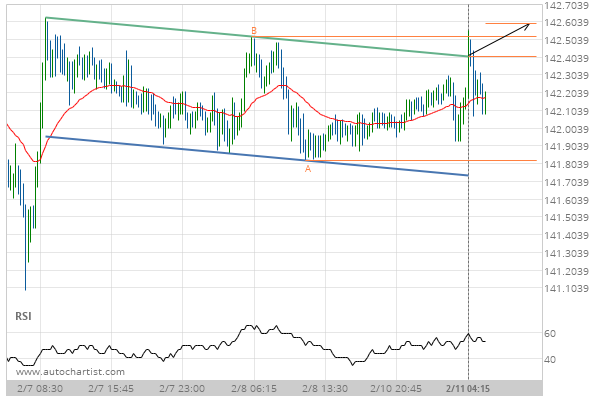
Channel Down has broken through the resistance line at 11-Feb-2019 04:15 EST. Possible bullish price movement forecast for the next 12 hours towards 142.5933.

Tags: GBPJPY
0 Likes
826 Views

You may also like

GBP/CAD down to 1.7259
March 13, 2020
AUD/USD down to 0.7207
November 23, 2018
GBP/USD down to 1.2853
February 8, 2019

Comments are closed.

GBP/CAD down to 1.6950 CAD/JPY up to 83.0839

Forex Technical Analysis – TD

EUR/CHF up to 1.1152

March 9, 2021 11:15 am | By Autochartist

Rising Wedge identified at 09-Mar-2021 00:00 EST. This pattern is... Read more →

EUR/JPY up to 129.6360

March 9, 2021 11:15 am | By Autochartist

Triangle identified at 08-Mar-2021 20:00 EST. This pattern is still... Read more →

NZD/USD up to 0.7188

March 9, 2021 11:15 am | By Autochartist

Broke through Resistance level of 0.7153 at 09-Mar-2021 04:00 EST Read more →

USD/JPY down to 108.1606

March 9, 2021 11:15 am | By Autochartist

Rising Wedge has broken through the support line at 09-Mar-2021... Read more →

USD/CHF down to 0.9284

March 9, 2021 11:15 am | By Autochartist

Approaching Support level of 0.9284 identified at 09-Mar-2021 05:15 EST Read more →

  • About Us
  • Privacy Policy
  • Disclaimer
  • Terms and Conditions
  • Get started for FREE
  • Contact Us
Copyright © 2022 Autochartist.com. All rights reserved.
This site uses cookies: Find out more.