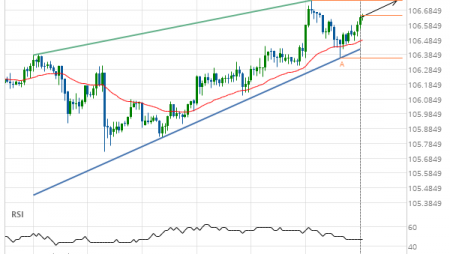
GBP/JPY down to 134.1722
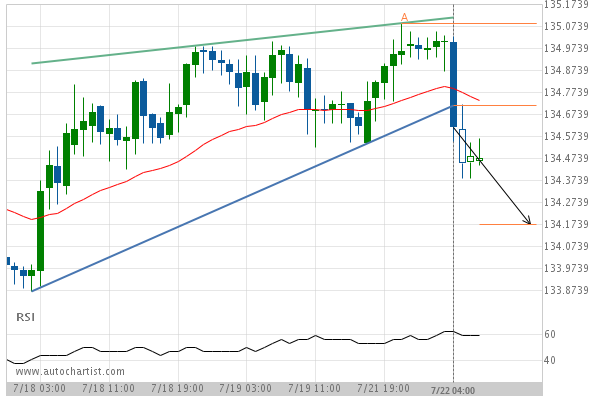
Rising Wedge has broken through the support line at 22-Jul-2019 04:00 EDT. Possible bearish price movement forecast for the next 13 hours towards 134.1722.
Rising Wedge has broken through the support line at 22-Jul-2019 04:00 EDT. Possible bearish price movement forecast for the next 13 hours towards 134.1722.