Exxon Mobil Corp. (XOM) down to 84.12
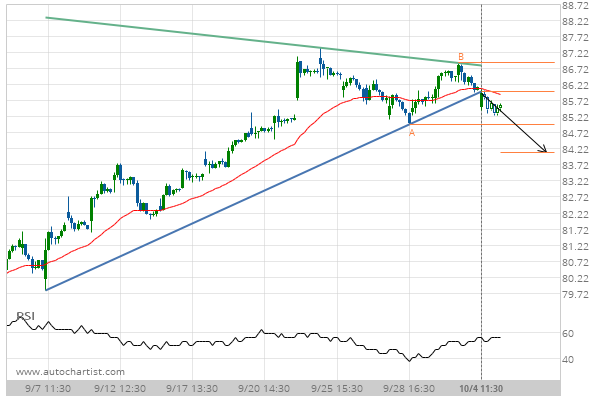
Triangle has broken through the support line at 04-Oct-2018 11:30 EDT. Possible bearish price movement forecast for the next 2 days towards 84.12.
Triangle has broken through the support line at 04-Oct-2018 11:30 EDT. Possible bearish price movement forecast for the next 2 days towards 84.12.