Exxon Mobil Corp. (XOM) down to 74.50
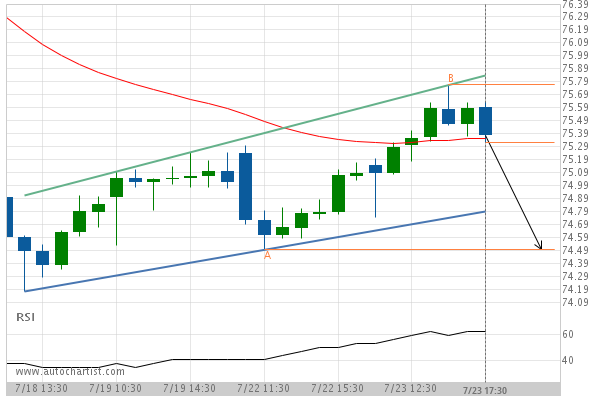
Flag identified at 23-Jul-2019 17:30 EDT. This pattern is still in the process of forming. Possible bearish price movement towards the support 74.50 within the next 8 hours.
Flag identified at 23-Jul-2019 17:30 EDT. This pattern is still in the process of forming. Possible bearish price movement towards the support 74.50 within the next 8 hours.