Help & Documentation
  • Home
  • Sign In
  • Contact Us
  • Home
  • Sign In
  • Contact Us

Exxon Mobil Corp. () up to 78.53

/US Stocks Technical Analysis - TD/Exxon Mobil Corp. () up to 78.53

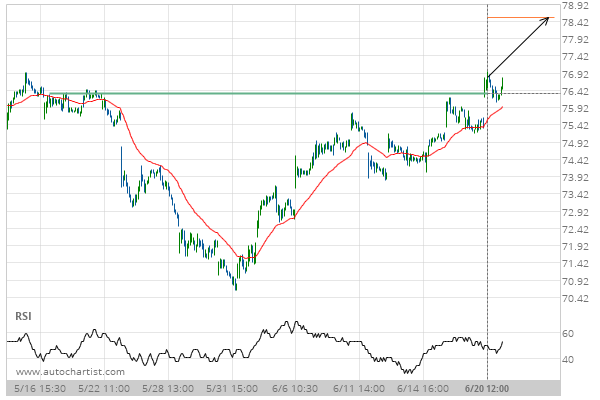
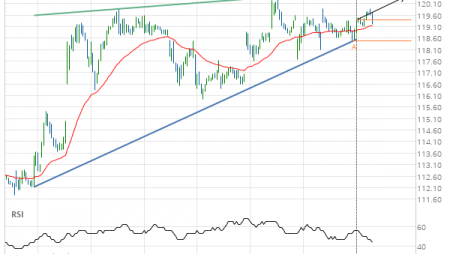
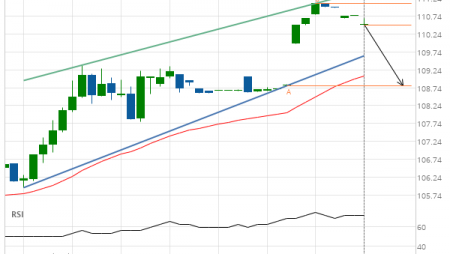
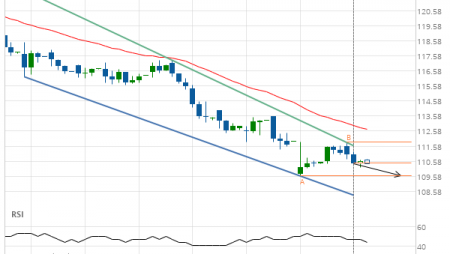
Exxon Mobil Corp. () up to 78.53

Posted on June 21, 2019 by Autochartist wrote in US Stocks Technical Analysis - TD.

Broke through Resistance level of 76.34 at 20-Jun-2019 12:00 EDT

Tags: Exxon Mobil Corp., XOM
0 Likes
636 Views

You may also like

Chevron (CVX) down to 107.94
November 26, 2018
Merck & Co. Inc. (MRK) down to 79.91
October 13, 2020
Chevron () up to 105.11
June 8, 2020

Comments are closed.

Apple Inc. (AAPL) up to 200.29 Walt Disney () up to 142.26

US Stocks Technical Analysis – TD

Merck & Co. Inc. (MRK) up to 75.56

March 9, 2021 11:13 am | By Autochartist

Rising Wedge identified at 08-Mar-2021 19:30 EST. This pattern is... Read more →

Visa (V) down to 215.41

March 9, 2021 11:13 am | By Autochartist

Triangle identified at 08-Mar-2021 20:00 EST. This pattern is still... Read more →

Jpmorgan Chase & Co. (JPM) down to 147.97

March 9, 2021 11:13 am | By Autochartist

Channel Up identified at 08-Mar-2021 19:00 EST. This pattern is... Read more →

Home Depot Inc. (HD) down to 247.10

March 9, 2021 11:13 am | By Autochartist

Channel Down identified at 08-Mar-2021 16:00 EST. This pattern is... Read more →

Intel Corporation () down to 58.10

March 9, 2021 11:13 am | By Autochartist

Approaching Support level of 58.10 identified at 08-Mar-2021 16:00 EST Read more →

  • About Us
  • Privacy Policy
  • Disclaimer
  • Terms and Conditions
  • Get started for FREE
  • Contact Us
Copyright © 2020 Autochartist.com. All rights reserved.
This site uses cookies: Find out more.