Help & Documentation
  • Home
  • Sign In
  • Contact Us
  • Home
  • Sign In
  • Contact Us

Exxon Mobil Corp. () up to 35.14

/US Stocks Technical Analysis - TD/Exxon Mobil Corp. () up to 35.14

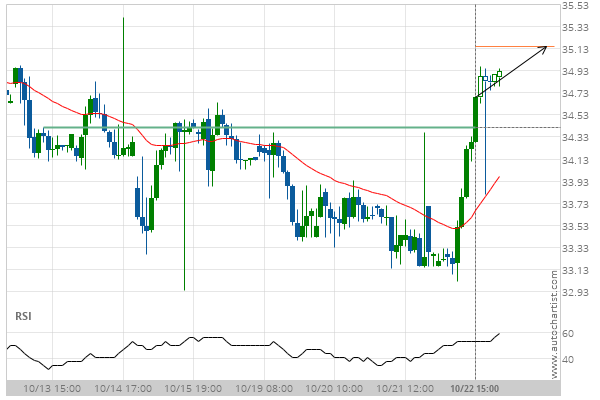
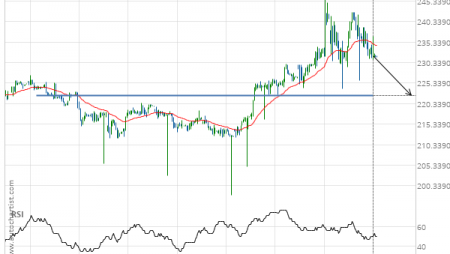
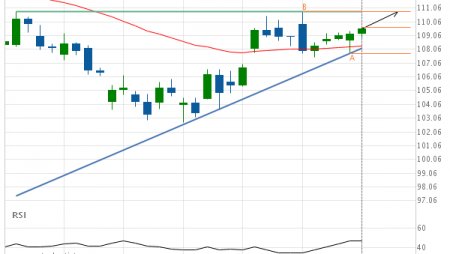
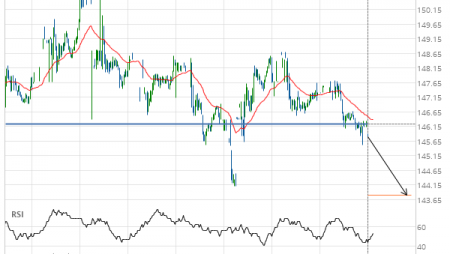
Exxon Mobil Corp. () up to 35.14

Posted on October 23, 2020 by Autochartist wrote in US Stocks Technical Analysis - TD.

Broke through Resistance level of 34.41 at 22-Oct-2020 15:00 EDT

Tags: Exxon Mobil Corp., XOM
0 Likes
265 Views

You may also like

Jpmorgan Chase & Co. (JPM) up to 88.75
March 24, 2020
Caterpillar Inc. (CAT) up to 127.28
June 5, 2020
Jpmorgan Chase & Co. () up to 93.30
May 8, 2020

Comments are closed.

Chevron (CVX) up to 73.64 Nike Inc. Cl B () up to 131.49

US Stocks Technical Analysis – TD

Merck & Co. Inc. (MRK) up to 75.56

March 9, 2021 11:13 am | By Autochartist

Rising Wedge identified at 08-Mar-2021 19:30 EST. This pattern is... Read more →

Jpmorgan Chase & Co. (JPM) down to 147.97

March 9, 2021 11:13 am | By Autochartist

Channel Up identified at 08-Mar-2021 19:00 EST. This pattern is... Read more →

Visa (V) down to 215.41

March 9, 2021 11:13 am | By Autochartist

Triangle identified at 08-Mar-2021 20:00 EST. This pattern is still... Read more →

Home Depot Inc. (HD) down to 247.10

March 9, 2021 11:13 am | By Autochartist

Channel Down identified at 08-Mar-2021 16:00 EST. This pattern is... Read more →

Intel Corporation () down to 58.10

March 9, 2021 11:13 am | By Autochartist

Approaching Support level of 58.10 identified at 08-Mar-2021 16:00 EST Read more →

  • About Us
  • Privacy Policy
  • Disclaimer
  • Terms and Conditions
  • Get started for FREE
  • Contact Us
Copyright © 2020 Autochartist.com. All rights reserved.
This site uses cookies: Find out more.