Help & Documentation
  • Home
  • Sign In
  • Contact Us
  • Home
  • Sign In
  • Contact Us

E-mini S&P 500 up to 3096.4801

/Futures Technical Analysis - TD/E-mini S&P 500 up to 3096.4801

E-mini S&P 500 up to 3096.4801

Posted on June 30, 2020 by Autochartist wrote in Futures Technical Analysis - TD.

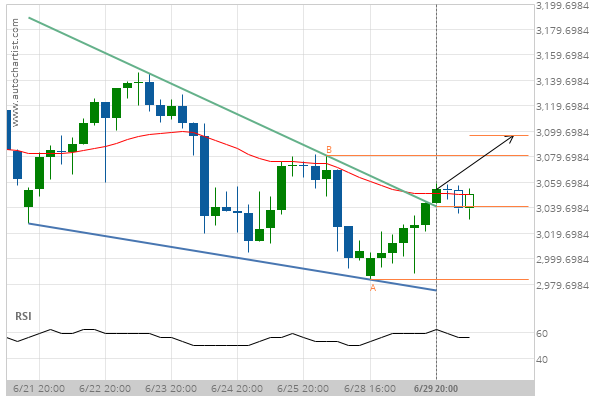
Falling Wedge has broken through the resistance line at 29-Jun-2020 20:00 EDT. Possible bullish price movement forecast for the next day towards 3096.4801.

Tags: CME, ES
0 Likes
380 Views

You may also like

Silver Front Month up to 23.6700
July 23, 2020
Corn down to 382.0000
November 4, 2019
Soybeans up to 861.2500
May 15, 2020

Comments are closed.

Silver Front Month up to 18.2850 Unitedhealth Group Inc. (UNH) down to 273.71

Futures Technical Analysis – TD

Light Sweet Crude Oil Front Month up to 67.9800

March 9, 2021 11:17 am | By Autochartist

Rising Wedge identified at 09-Mar-2021 05:00 EST. This pattern is... Read more →

Feeder Cattle Front Month down to 137.2250

March 9, 2021 11:17 am | By Autochartist

Channel Down identified at 08-Mar-2021 14:00 EST. This pattern is... Read more →

Soybean Oil up to 53.2300

March 9, 2021 11:17 am | By Autochartist

Channel Up identified at 09-Mar-2021 04:30 EST. This pattern is... Read more →

Silver Front Month up to 26.5600

March 9, 2021 11:17 am | By Autochartist

Approaching Resistance level of 26.5600 identified at 09-Mar-2021 04:00 EST Read more →

10 year T-Note up to 133.1644

March 9, 2021 11:17 am | By Autochartist

Falling Wedge has broken through the resistance line at 09-Mar-2021... Read more →

  • About Us
  • Privacy Policy
  • Disclaimer
  • Terms and Conditions
  • Get started for FREE
  • Contact Us
Copyright © 2020 Autochartist.com. All rights reserved.
This site uses cookies: Find out more.