Help & Documentation
  • Home
  • Sign In
  • Contact Us
  • Home
  • Sign In
  • Contact Us

E-mini S&P 500 up to 2969.0249

/Futures Technical Analysis - TD/E-mini S&P 500 up to 2969.0249

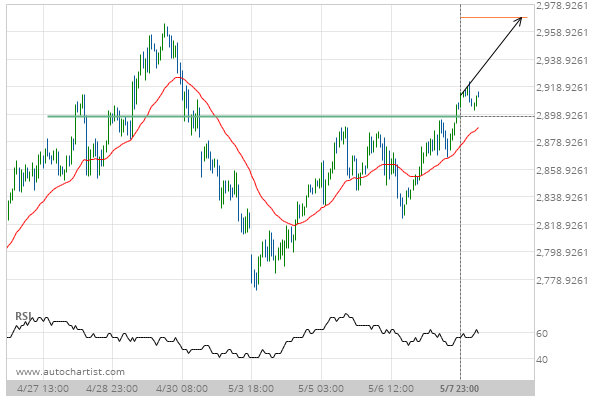
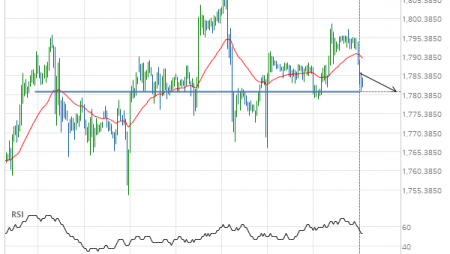
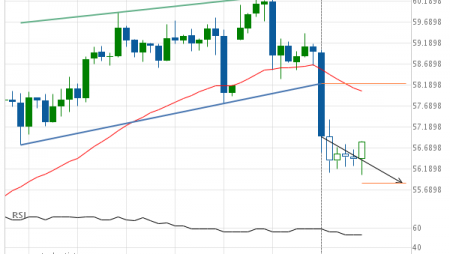
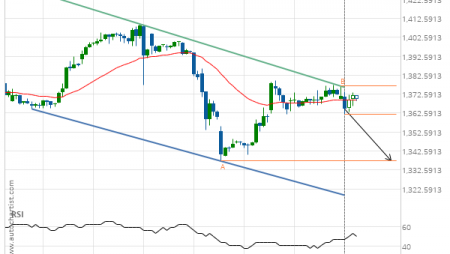
E-mini S&P 500 up to 2969.0249

Posted on May 8, 2020 by Autochartist wrote in Futures Technical Analysis - TD.

Broke through Resistance level of 2897.2500 at 07-May-2020 23:00 EDT

Tags: ES
0 Likes
407 Views

You may also like

Soybean Oil up to 45.4300
January 28, 2021
US T-Bond down to 171.8750
December 14, 2020
Light Sweet Crude Oil Front Month down to 54.8300
September 10, 2019

Comments are closed.

US T-Bond down to 181.1075 Soybean Oil up to 26.8000

Futures Technical Analysis – TD

Light Sweet Crude Oil Front Month up to 67.9800

March 9, 2021 11:17 am | By Autochartist

Rising Wedge identified at 09-Mar-2021 05:00 EST. This pattern is... Read more →

Feeder Cattle Front Month down to 137.2250

March 9, 2021 11:17 am | By Autochartist

Channel Down identified at 08-Mar-2021 14:00 EST. This pattern is... Read more →

Soybean Oil up to 53.2300

March 9, 2021 11:17 am | By Autochartist

Channel Up identified at 09-Mar-2021 04:30 EST. This pattern is... Read more →

Silver Front Month up to 26.5600

March 9, 2021 11:17 am | By Autochartist

Approaching Resistance level of 26.5600 identified at 09-Mar-2021 04:00 EST Read more →

10 year T-Note up to 133.1644

March 9, 2021 11:17 am | By Autochartist

Falling Wedge has broken through the resistance line at 09-Mar-2021... Read more →

  • About Us
  • Privacy Policy
  • Disclaimer
  • Terms and Conditions
  • Get started for FREE
  • Contact Us
Copyright © 2020 Autochartist.com. All rights reserved.
This site uses cookies: Find out more.