Help & Documentation
  • Home
  • Sign In
  • Contact Us
  • Home
  • Sign In
  • Contact Us

E-mini S&P 500 up to 2902.6001

/Futures Technical Analysis - TD/E-mini S&P 500 up to 2902.6001

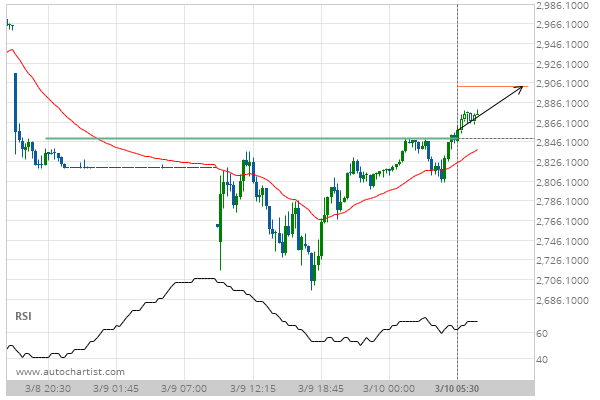
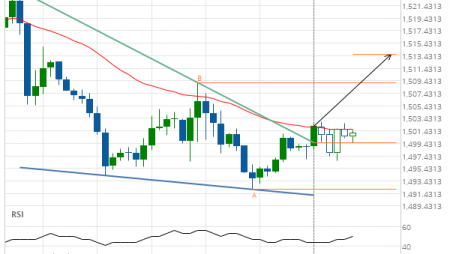
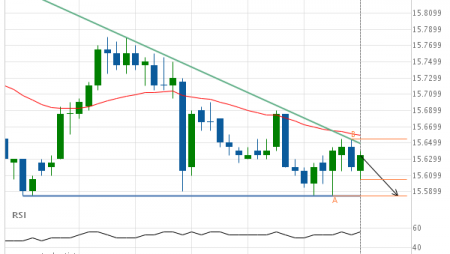
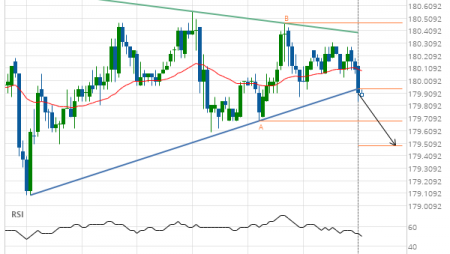
E-mini S&P 500 up to 2902.6001

Posted on March 10, 2020 by Autochartist wrote in Futures Technical Analysis - TD.

Broke through Resistance level of 2849.7500 at 10-Mar-2020 05:30 EDT

Tags: ES
0 Likes
598 Views

You may also like

Silver Front Month down to 15.0665
April 8, 2019
Lean Hogs up to 68.0000
September 13, 2019
Light Sweet Crude Oil Front Month up to 36.5330
March 10, 2020

Comments are closed.

Light Sweet Crude Oil Front Month up to 36.5330 Corn up to 381.8250

Futures Technical Analysis – TD

Light Sweet Crude Oil Front Month up to 67.9800

March 9, 2021 11:17 am | By Autochartist

Rising Wedge identified at 09-Mar-2021 05:00 EST. This pattern is... Read more →

Feeder Cattle Front Month down to 137.2250

March 9, 2021 11:17 am | By Autochartist

Channel Down identified at 08-Mar-2021 14:00 EST. This pattern is... Read more →

Soybean Oil up to 53.2300

March 9, 2021 11:17 am | By Autochartist

Channel Up identified at 09-Mar-2021 04:30 EST. This pattern is... Read more →

Silver Front Month up to 26.5600

March 9, 2021 11:17 am | By Autochartist

Approaching Resistance level of 26.5600 identified at 09-Mar-2021 04:00 EST Read more →

10 year T-Note up to 133.1644

March 9, 2021 11:17 am | By Autochartist

Falling Wedge has broken through the resistance line at 09-Mar-2021... Read more →

  • About Us
  • Privacy Policy
  • Disclaimer
  • Terms and Conditions
  • Get started for FREE
  • Contact Us
Copyright © 2022 Autochartist.com. All rights reserved.
This site uses cookies: Find out more.