Help & Documentation
  • Home
  • Sign In
  • Contact Us
  • Home
  • Sign In
  • Contact Us

E-mini S&P 500 up to 2899.9250

/Futures Technical Analysis - TD/E-mini S&P 500 up to 2899.9250

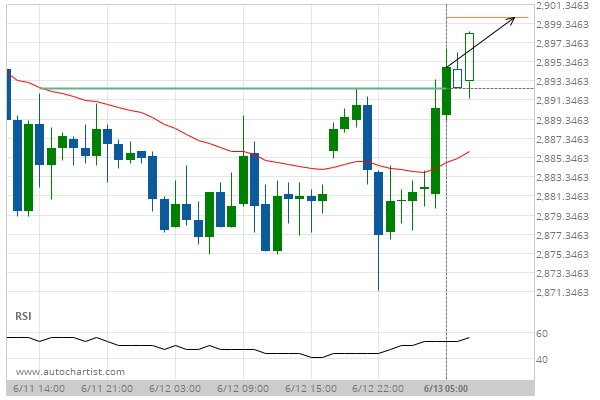
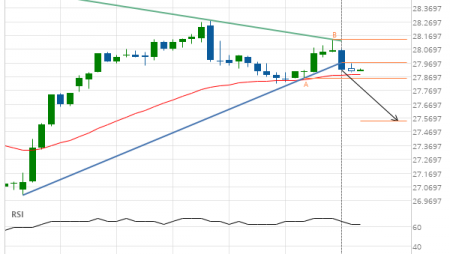
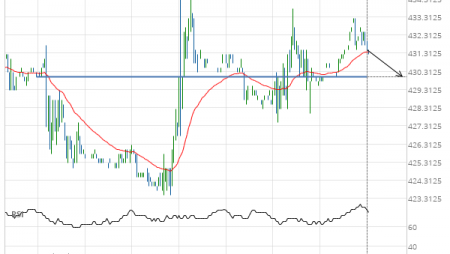
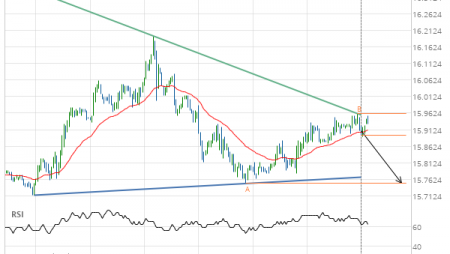
E-mini S&P 500 up to 2899.9250

Posted on June 13, 2019 by Autochartist wrote in Futures Technical Analysis - TD.

Broke through Resistance level of 2892.5000 at 13-Jun-2019 05:00 EDT

Tags: ES
0 Likes
820 Views

You may also like

Lean Hogs down to 63.1000
September 9, 2019
Soybean Oil up to 28.9500
July 8, 2020
Feeder Cattle Front Month down to 106.5750
April 3, 2020

Comments are closed.

Gold Front Month up to 1348.9000 Procter & Gamble Co. (PG) excessive bearish movement

Futures Technical Analysis – TD

Light Sweet Crude Oil Front Month up to 67.9800

March 9, 2021 11:17 am | By Autochartist

Rising Wedge identified at 09-Mar-2021 05:00 EST. This pattern is... Read more →

Feeder Cattle Front Month down to 137.2250

March 9, 2021 11:17 am | By Autochartist

Channel Down identified at 08-Mar-2021 14:00 EST. This pattern is... Read more →

Soybean Oil up to 53.2300

March 9, 2021 11:17 am | By Autochartist

Channel Up identified at 09-Mar-2021 04:30 EST. This pattern is... Read more →

Silver Front Month up to 26.5600

March 9, 2021 11:17 am | By Autochartist

Approaching Resistance level of 26.5600 identified at 09-Mar-2021 04:00 EST Read more →

10 year T-Note up to 133.1644

March 9, 2021 11:17 am | By Autochartist

Falling Wedge has broken through the resistance line at 09-Mar-2021... Read more →

  • About Us
  • Privacy Policy
  • Disclaimer
  • Terms and Conditions
  • Get started for FREE
  • Contact Us
Copyright © 2022 Autochartist.com. All rights reserved.
This site uses cookies: Find out more.