Help & Documentation
  • Home
  • Sign In
  • Contact Us
  • Home
  • Sign In
  • Contact Us

E-mini S&P 500 up to 2724.7972

/Futures Technical Analysis - TD/E-mini S&P 500 up to 2724.7972

E-mini S&P 500 up to 2724.7972

Posted on April 1, 2020 by Autochartist wrote in Futures Technical Analysis - TD.

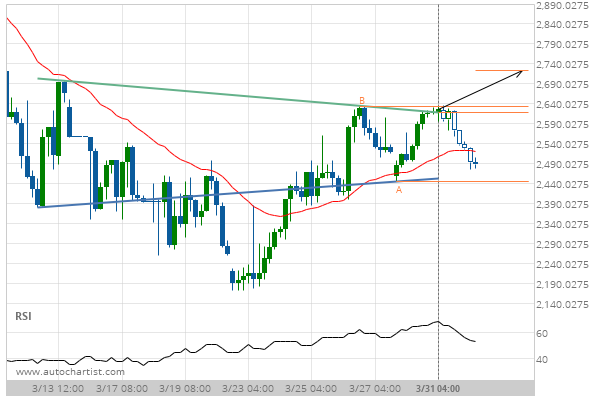
Inverse Head and Shoulders has broken through the resistance line at 31-Mar-2020 04:00 EDT. Possible bullish price movement forecast for the next 3 days towards 2724.7972.

Tags: CME, ES
0 Likes
440 Views

You may also like

E-mini S&P 500 up to 2672.5000
January 30, 2019
E-mini S&P 500 up to 3013.7500
September 26, 2019
Soybeans up to 918.7500
February 12, 2019

Comments are closed.

Light Sweet Crude Oil Front Month down to 19.2700 Feeder Cattle Front Month up to 134.0000

Futures Technical Analysis – TD

Light Sweet Crude Oil Front Month up to 67.9800

March 9, 2021 11:17 am | By Autochartist

Rising Wedge identified at 09-Mar-2021 05:00 EST. This pattern is... Read more →

Feeder Cattle Front Month down to 137.2250

March 9, 2021 11:17 am | By Autochartist

Channel Down identified at 08-Mar-2021 14:00 EST. This pattern is... Read more →

Soybean Oil up to 53.2300

March 9, 2021 11:17 am | By Autochartist

Channel Up identified at 09-Mar-2021 04:30 EST. This pattern is... Read more →

Silver Front Month up to 26.5600

March 9, 2021 11:17 am | By Autochartist

Approaching Resistance level of 26.5600 identified at 09-Mar-2021 04:00 EST Read more →

10 year T-Note up to 133.1644

March 9, 2021 11:17 am | By Autochartist

Falling Wedge has broken through the resistance line at 09-Mar-2021... Read more →

  • About Us
  • Privacy Policy
  • Disclaimer
  • Terms and Conditions
  • Get started for FREE
  • Contact Us
Copyright © 2020 Autochartist.com. All rights reserved.
This site uses cookies: Find out more.