Help & Documentation
  • Home
  • Sign In
  • Contact Us
  • Home
  • Sign In
  • Contact Us

E-mini S&P 500 down to 2757.7397

/Futures Technical Analysis - TD/E-mini S&P 500 down to 2757.7397

E-mini S&P 500 down to 2757.7397

Posted on April 21, 2020 by Autochartist wrote in Futures Technical Analysis - TD.

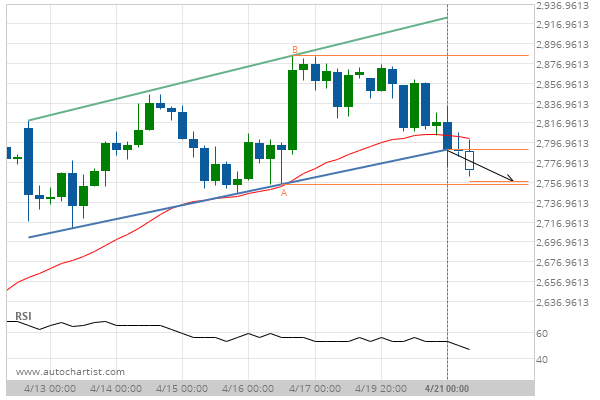
Channel Up has broken through the support line at 21-Apr-2020 00:00 EDT. Possible bearish price movement forecast for the next 2 days towards 2757.7397.

Tags: CME, ES
0 Likes
523 Views

You may also like

10 year T-Note up to 128.5234
December 26, 2019
Soybeans up to 882.0000
August 13, 2019
Lean Hogs down to 63.6000
November 17, 2020

Comments are closed.

Silver Front Month down to 14.7530 Verizon Communications Inc. (VZ) excessive bearish movement

Futures Technical Analysis – TD

Light Sweet Crude Oil Front Month up to 67.9800

March 9, 2021 11:17 am | By Autochartist

Rising Wedge identified at 09-Mar-2021 05:00 EST. This pattern is... Read more →

Feeder Cattle Front Month down to 137.2250

March 9, 2021 11:17 am | By Autochartist

Channel Down identified at 08-Mar-2021 14:00 EST. This pattern is... Read more →

Soybean Oil up to 53.2300

March 9, 2021 11:17 am | By Autochartist

Channel Up identified at 09-Mar-2021 04:30 EST. This pattern is... Read more →

Silver Front Month up to 26.5600

March 9, 2021 11:17 am | By Autochartist

Approaching Resistance level of 26.5600 identified at 09-Mar-2021 04:00 EST Read more →

10 year T-Note up to 133.1644

March 9, 2021 11:17 am | By Autochartist

Falling Wedge has broken through the resistance line at 09-Mar-2021... Read more →

  • About Us
  • Privacy Policy
  • Disclaimer
  • Terms and Conditions
  • Get started for FREE
  • Contact Us
Copyright © 2022 Autochartist.com. All rights reserved.
This site uses cookies: Find out more.