Daily Forex Update: NZD/CAD
By: Dima Chernovolov
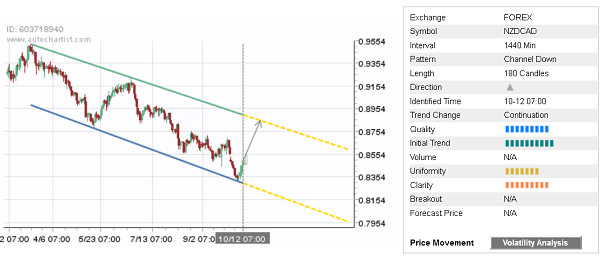
NZD/CAD continues to rise inside the uniform daily Down Channel chart pattern which was recently identified by Autochartist. Autochartist measures the quality of this Down Channel at the high 9-bar level – which reflects the sharp Initial Trend (10 bars), significant Uniformity (7 bars) and near-maximum Clarity (9 bars). NZD/CAD is expected to fall further inside this Down Channel – in line with the earlier upward reversal from the powerful support area shown below.
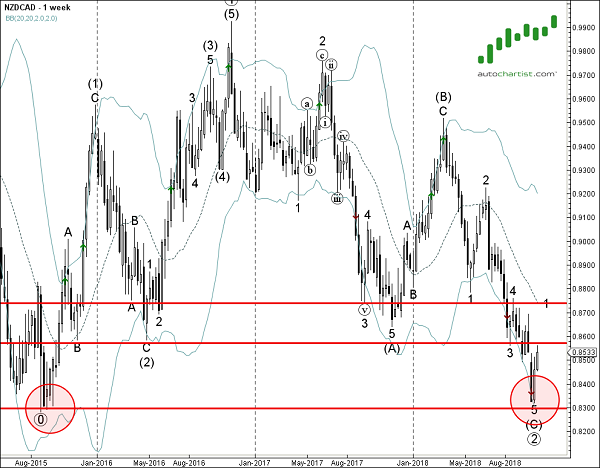
As can be seen from the weekly NZD/CAD chart below, the bottom of this Down Channel formed when the pair reversed up with from the powerful support area located between the long-term support level 0.8300 (which stopped the sharp downtrend in 2015) and the lower weekly Bollinger Band. The proximity of this support zone increases the probability NZD/CAD will continue to rise inside this Down Channel.
To subscribe to the e-mail alerts feature is quick and easy. Log into the Autochartist platform, click on ‘Alerts & Messaging’, enter your email address, select the market you want covered, select your language, and the time you want to get your report, and you’re done! You will now receive a quick morning technical outlook of the markets.
For further information on this and other Autochartist products visit www.autochartist.com