Daily Forex Update: GBP/NZD
By: Dima Chernovolov
GBP/NZD continues to fall after the recent breakout of the hourly Triangle chart pattern which was recently identified by Autochartist. Autochartist rates the quality of this Triangle at the 7-bar level – which is the result of the below-average Initial Trend (4 bars), significant Uniformity (7 bars) and above-average Clarity (6 bars). GBP/NZD is expected to fall toward the forecast price 1.8736 – in line with the earlier downward reversal from the key resistance area shown below.
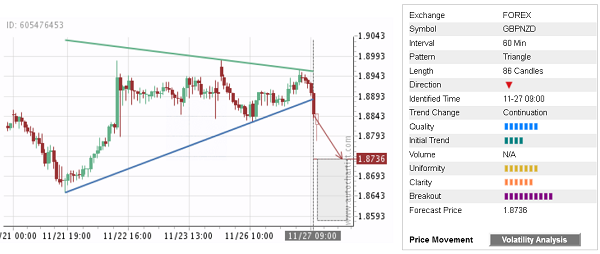
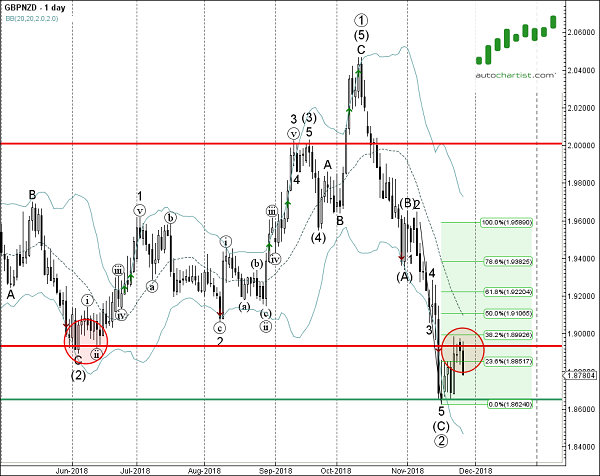
As can be seen from the daily GBP/NZD chart below, the price earlier reversed down from the combined resistance area lying between the key resistance level 1.8930 (former powerful support from June) and the 38.2% Fibonacci correction of the previous downward impulse from the start of November. The proximity of this resistance area increases the probability GBP/NZD will continue to fall toward the forecast price 1.8736.
To subscribe to the e-mail alerts feature is quick and easy. Log into the Autochartist platform, click on ‘Alerts & Messaging’, enter your email address, select the market you want covered, select your language, and the time you want to get your report, and you’re done! You will now receive a quick morning technical outlook of the markets.
For further information on this and other Autochartist products visit www.autochartist.com