Help & Documentation
  • Home
  • Sign In
  • Contact Us
  • Home
  • Sign In
  • Contact Us

Corn up to 524.0000

/Futures Technical Analysis - TD/Corn up to 524.0000

Corn up to 524.0000

Posted on January 20, 2021 by Autochartist wrote in Futures Technical Analysis - TD.

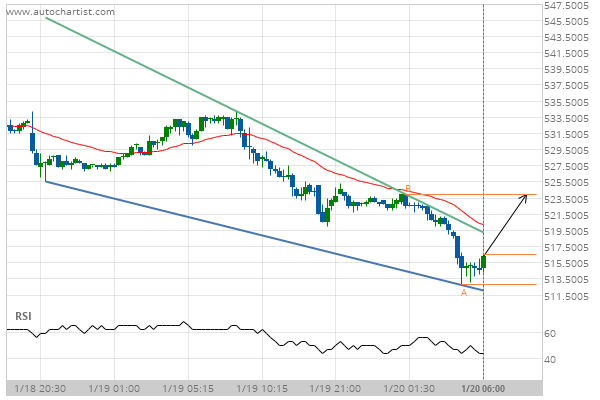
Falling Wedge identified at 20-Jan-2021 06:00 EST. This pattern is still in the process of forming. Possible bullish price movement towards the resistance 524.0000 within the next 9 hours.

Tags: CBOT, ZC
0 Likes
251 Views

You may also like

Soybean Meal up to 308.6302
November 8, 2019
Lean Hogs up to 66.9500
May 15, 2020
Gold Front Month up to 1427.8000
July 2, 2019

Comments are closed.

Gold Front Month down to 1838.7000 Soybeans up to 1410.0000

Futures Technical Analysis – TD

Light Sweet Crude Oil Front Month up to 67.9800

March 9, 2021 11:17 am | By Autochartist

Rising Wedge identified at 09-Mar-2021 05:00 EST. This pattern is... Read more →

Feeder Cattle Front Month down to 137.2250

March 9, 2021 11:17 am | By Autochartist

Channel Down identified at 08-Mar-2021 14:00 EST. This pattern is... Read more →

Soybean Oil up to 53.2300

March 9, 2021 11:17 am | By Autochartist

Channel Up identified at 09-Mar-2021 04:30 EST. This pattern is... Read more →

Silver Front Month up to 26.5600

March 9, 2021 11:17 am | By Autochartist

Approaching Resistance level of 26.5600 identified at 09-Mar-2021 04:00 EST Read more →

10 year T-Note up to 133.1644

March 9, 2021 11:17 am | By Autochartist

Falling Wedge has broken through the resistance line at 09-Mar-2021... Read more →

  • About Us
  • Privacy Policy
  • Disclaimer
  • Terms and Conditions
  • Get started for FREE
  • Contact Us
Copyright © 2020 Autochartist.com. All rights reserved.
This site uses cookies: Find out more.