Help & Documentation
  • Home
  • Sign In
  • Contact Us
  • Home
  • Sign In
  • Contact Us

Corn up to 429.2500

/Futures Technical Analysis - TD/Corn up to 429.2500

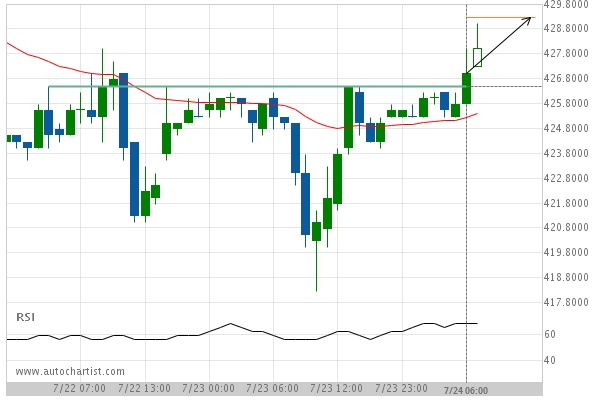
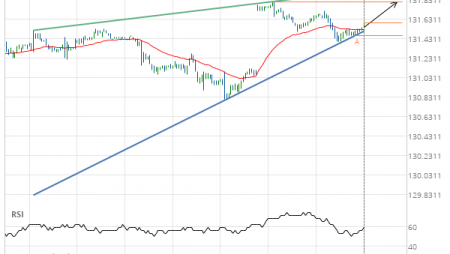
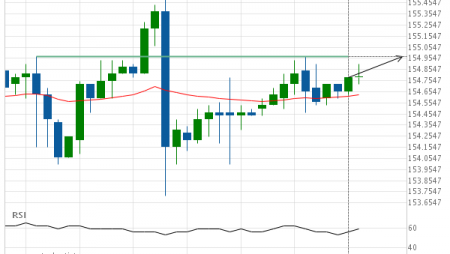
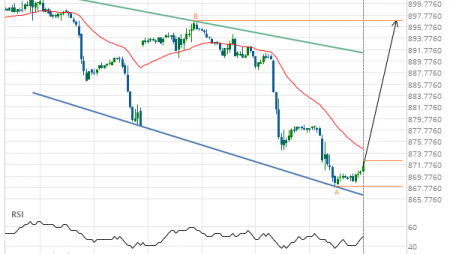
Corn up to 429.2500

Posted on July 24, 2019 by Autochartist wrote in Futures Technical Analysis - TD.

Broke through Resistance level of 426.5000 at 24-Jul-2019 06:00 EDT

Tags: ZC
0 Likes
728 Views

You may also like

10 year T-Note up to 122.1875
January 17, 2019
Feeder Cattle Front Month up to 145.5750
February 11, 2019
Soybean Oil down to 27.6000
August 6, 2019

Comments are closed.

Should we expect a breakout or a rebound on Home Depot Inc.? Soybeans up to 910.0000

Futures Technical Analysis – TD

Light Sweet Crude Oil Front Month up to 67.9800

March 9, 2021 11:17 am | By Autochartist

Rising Wedge identified at 09-Mar-2021 05:00 EST. This pattern is... Read more →

Feeder Cattle Front Month down to 137.2250

March 9, 2021 11:17 am | By Autochartist

Channel Down identified at 08-Mar-2021 14:00 EST. This pattern is... Read more →

Soybean Oil up to 53.2300

March 9, 2021 11:17 am | By Autochartist

Channel Up identified at 09-Mar-2021 04:30 EST. This pattern is... Read more →

Silver Front Month up to 26.5600

March 9, 2021 11:17 am | By Autochartist

Approaching Resistance level of 26.5600 identified at 09-Mar-2021 04:00 EST Read more →

10 year T-Note up to 133.1644

March 9, 2021 11:17 am | By Autochartist

Falling Wedge has broken through the resistance line at 09-Mar-2021... Read more →

  • About Us
  • Privacy Policy
  • Disclaimer
  • Terms and Conditions
  • Get started for FREE
  • Contact Us
Copyright © 2022 Autochartist.com. All rights reserved.
This site uses cookies: Find out more.