Help & Documentation
  • Home
  • Sign In
  • Contact Us
  • Home
  • Sign In
  • Contact Us

Corn up to 383.8268

/Futures Technical Analysis - TD/Corn up to 383.8268

Corn up to 383.8268

Posted on November 19, 2019 by Autochartist wrote in Futures Technical Analysis - TD.

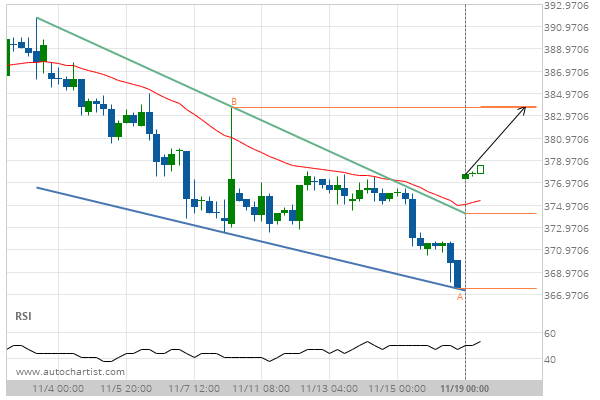
Falling Wedge has broken through the resistance line at 19-Nov-2019 00:00 EST. Possible bullish price movement forecast for the next 3 days towards 383.8268.

Tags: CBOT, ZC
0 Likes
623 Views

You may also like

Light Sweet Crude Oil Front Month up to 57.0800
July 26, 2019
Soybean Oil down to 33.8000
December 24, 2019
Corn down to 373.0000
December 4, 2019

Comments are closed.

Unitedhealth Group Inc. (UNH) excessive bullish movement Light Sweet Crude Oil Front Month down to 56.2700

Futures Technical Analysis – TD

Light Sweet Crude Oil Front Month up to 67.9800

March 9, 2021 11:17 am | By Autochartist

Rising Wedge identified at 09-Mar-2021 05:00 EST. This pattern is... Read more →

Feeder Cattle Front Month down to 137.2250

March 9, 2021 11:17 am | By Autochartist

Channel Down identified at 08-Mar-2021 14:00 EST. This pattern is... Read more →

Soybean Oil up to 53.2300

March 9, 2021 11:17 am | By Autochartist

Channel Up identified at 09-Mar-2021 04:30 EST. This pattern is... Read more →

Silver Front Month up to 26.5600

March 9, 2021 11:17 am | By Autochartist

Approaching Resistance level of 26.5600 identified at 09-Mar-2021 04:00 EST Read more →

10 year T-Note up to 133.1644

March 9, 2021 11:17 am | By Autochartist

Falling Wedge has broken through the resistance line at 09-Mar-2021... Read more →

  • About Us
  • Privacy Policy
  • Disclaimer
  • Terms and Conditions
  • Get started for FREE
  • Contact Us
Copyright © 2022 Autochartist.com. All rights reserved.
This site uses cookies: Find out more.