Help & Documentation
  • Home
  • Sign In
  • Contact Us
  • Home
  • Sign In
  • Contact Us

Corn up to 381.5000

/Futures Technical Analysis - TD/Corn up to 381.5000

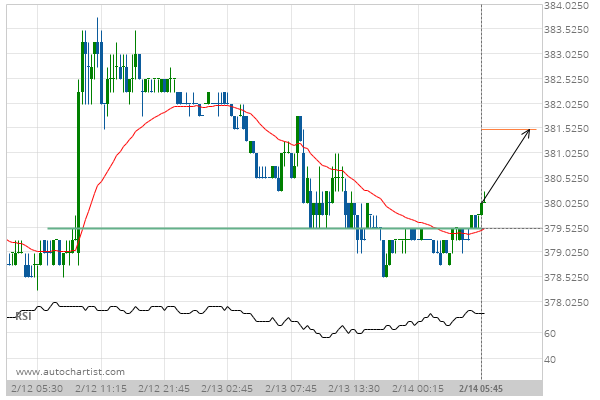
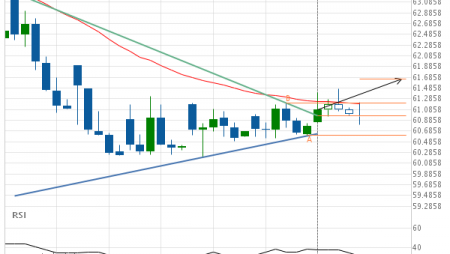
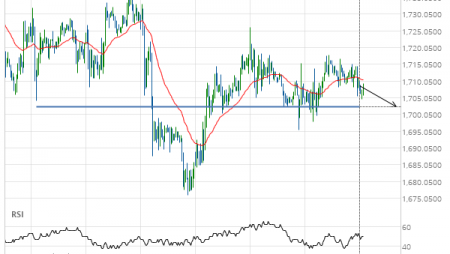
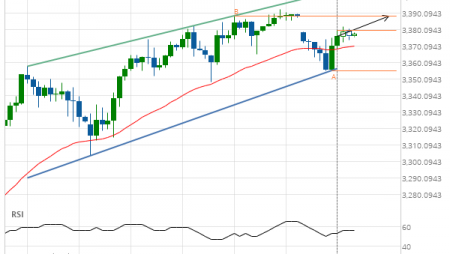
Corn up to 381.5000

Posted on February 14, 2020 by Autochartist wrote in Futures Technical Analysis - TD.

Broke through Resistance level of 379.5000 at 14-Feb-2020 05:45 EST

Tags: ZC
0 Likes
557 Views

You may also like

KC HRW Wheat up to 515.5000
October 1, 2020
Gold Front Month up to 1732.2000
June 3, 2020
Gold Front Month up to 1297.7000
March 4, 2019

Comments are closed.

E-mini S&P 500 up to 3388.5000 Microsoft Corporation () down to 182.82

Futures Technical Analysis – TD

Light Sweet Crude Oil Front Month up to 67.9800

March 9, 2021 11:17 am | By Autochartist

Rising Wedge identified at 09-Mar-2021 05:00 EST. This pattern is... Read more →

Feeder Cattle Front Month down to 137.2250

March 9, 2021 11:17 am | By Autochartist

Channel Down identified at 08-Mar-2021 14:00 EST. This pattern is... Read more →

Soybean Oil up to 53.2300

March 9, 2021 11:17 am | By Autochartist

Channel Up identified at 09-Mar-2021 04:30 EST. This pattern is... Read more →

Silver Front Month up to 26.5600

March 9, 2021 11:17 am | By Autochartist

Approaching Resistance level of 26.5600 identified at 09-Mar-2021 04:00 EST Read more →

10 year T-Note up to 133.1644

March 9, 2021 11:17 am | By Autochartist

Falling Wedge has broken through the resistance line at 09-Mar-2021... Read more →

  • About Us
  • Privacy Policy
  • Disclaimer
  • Terms and Conditions
  • Get started for FREE
  • Contact Us
Copyright © 2022 Autochartist.com. All rights reserved.
This site uses cookies: Find out more.