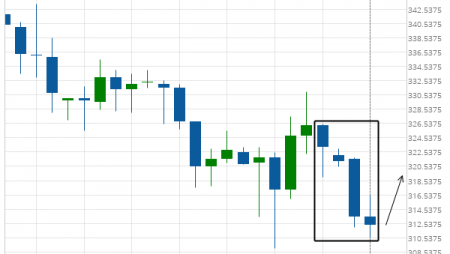
CORN SEPTEMBER 2020 excessive bearish movement
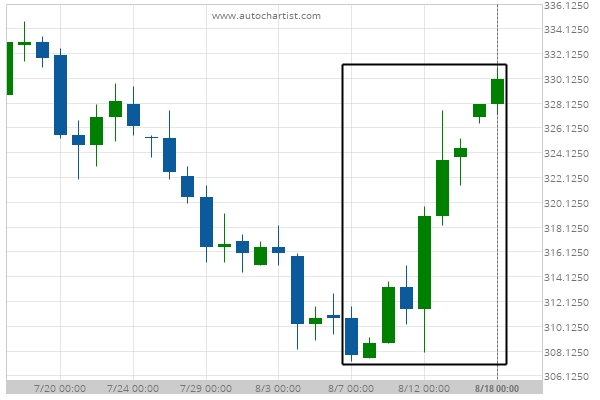
CORN SEPTEMBER 2020 experienced a 7.23% bullish movement in the last 11 days.
CORN SEPTEMBER 2020 experienced a 7.23% bullish movement in the last 11 days.