Help & Documentation
  • Home
  • Sign In
  • Contact Us
  • Home
  • Sign In
  • Contact Us

CORN SEPTEMBER 2020 excessive bearish movement

/Futures Statistical Analysis - TD/CORN SEPTEMBER 2020 excessive bearish movement

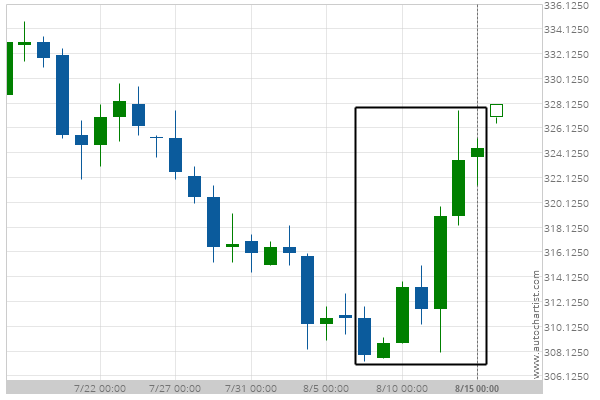
CORN SEPTEMBER 2020 excessive bearish movement

Posted on August 17, 2020 by Autochartist wrote in Futures Statistical Analysis - TD.

CORN SEPTEMBER 2020 experienced a 5.44% bullish movement in the last 8 days.

Tags: Big Movement, ZC
0 Likes
502 Views

You may also like

Corn March 2019 excessive bearish movement
January 14, 2019
10 year T-Note excessive bearish movement
January 12, 2021
Feeder Cattle Front Month excessive bullish movement
November 6, 2020

Comments are closed.

KC HRW Wheat excessive bullish movement CHF/JPY down to 114.9738

Futures Statistical Analysis – TD

Soybean Oil excessive bearish movement

March 9, 2021 11:16 am | By Autochartist

Soybean Oil experienced a 19.04% bullish movement in the last... Read more →

Corn excessive bearish movement

March 8, 2021 11:19 am | By Autochartist

Corn experienced a 4.61% bullish movement in the last 73... Read more →

Gold Front Month excessive bearish movement

March 8, 2021 11:19 am | By Autochartist

Gold Front Month experienced a 6.29% bearish movement in the... Read more →

Light Sweet Crude Oil Front Month excessive bearish movement

March 8, 2021 11:19 am | By Autochartist

Light Sweet Crude Oil Front Month experienced a 8.6% bullish... Read more →

10 year T-Note excessive bearish movement

March 8, 2021 11:19 am | By Autochartist

10 year T-Note experienced a 3.4% bearish movement in the... Read more →

  • About Us
  • Privacy Policy
  • Disclaimer
  • Terms and Conditions
  • Get started for FREE
  • Contact Us
Copyright © 2022 Autochartist.com. All rights reserved.
This site uses cookies: Find out more.