Help & Documentation
  • Home
  • Sign In
  • Contact Us
  • Home
  • Sign In
  • Contact Us

Corn excessive bearish movement

/Futures Statistical Analysis - TD/Corn excessive bearish movement

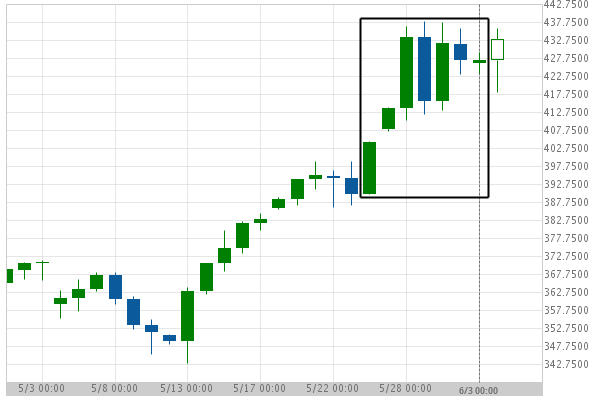
Corn excessive bearish movement

Posted on June 4, 2019 by Autochartist wrote in Futures Statistical Analysis - TD.

Corn experienced a 9.49% bullish movement in the last 10 days.

Tags: Big Movement, ZC
0 Likes
583 Views

You may also like

CORN DECEMBER 2018 excessive bullish movement
November 6, 2018
Soybean Meal excessive bearish movement
September 21, 2020
Lean Hogs excessive bearish movement
April 17, 2020

Comments are closed.

Gold Front Month excessive bearish movement Silver JULY 2019 has broken through support

Futures Statistical Analysis – TD

Soybean Oil excessive bearish movement

March 9, 2021 11:16 am | By Autochartist

Soybean Oil experienced a 19.04% bullish movement in the last... Read more →

Corn excessive bearish movement

March 8, 2021 11:19 am | By Autochartist

Corn experienced a 4.61% bullish movement in the last 73... Read more →

Gold Front Month excessive bearish movement

March 8, 2021 11:19 am | By Autochartist

Gold Front Month experienced a 6.29% bearish movement in the... Read more →

Light Sweet Crude Oil Front Month excessive bearish movement

March 8, 2021 11:19 am | By Autochartist

Light Sweet Crude Oil Front Month experienced a 8.6% bullish... Read more →

10 year T-Note excessive bearish movement

March 8, 2021 11:19 am | By Autochartist

10 year T-Note experienced a 3.4% bearish movement in the... Read more →

  • About Us
  • Privacy Policy
  • Disclaimer
  • Terms and Conditions
  • Get started for FREE
  • Contact Us
Copyright © 2020 Autochartist.com. All rights reserved.
This site uses cookies: Find out more.