Help & Documentation
  • Home
  • Sign In
  • Contact Us
  • Home
  • Sign In
  • Contact Us

Corn down to 409.7500

/Futures Technical Analysis - TD/Corn down to 409.7500

Corn down to 409.7500

Posted on August 9, 2019 by Autochartist wrote in Futures Technical Analysis - TD.

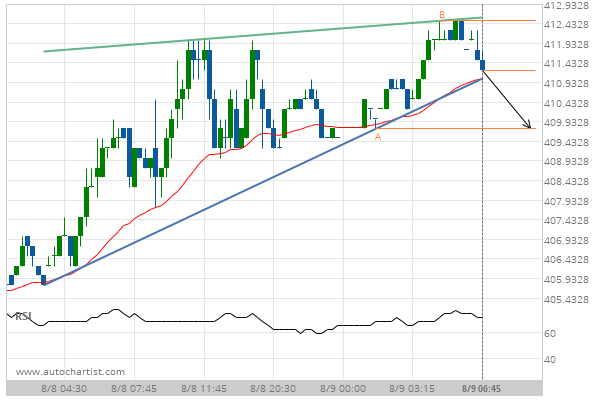
Rising Wedge identified at 09-Aug-2019 06:45 EDT. This pattern is still in the process of forming. Possible bearish price movement towards the support 409.7500 within the next 7 hours.

Tags: CBOT, ZC
0 Likes
620 Views

You may also like

US T-Bond down to 178.5313
May 21, 2020
Soybeans up to 882.0000
August 29, 2019
KC HRW Wheat up to 412.5000
September 30, 2019

Comments are closed.

Lean Hogs up to 69.8569 Feeder Cattle Front Month down to 134.5750

Futures Technical Analysis – TD

Light Sweet Crude Oil Front Month up to 67.9800

March 9, 2021 11:17 am | By Autochartist

Rising Wedge identified at 09-Mar-2021 05:00 EST. This pattern is... Read more →

Feeder Cattle Front Month down to 137.2250

March 9, 2021 11:17 am | By Autochartist

Channel Down identified at 08-Mar-2021 14:00 EST. This pattern is... Read more →

Soybean Oil up to 53.2300

March 9, 2021 11:17 am | By Autochartist

Channel Up identified at 09-Mar-2021 04:30 EST. This pattern is... Read more →

Silver Front Month up to 26.5600

March 9, 2021 11:17 am | By Autochartist

Approaching Resistance level of 26.5600 identified at 09-Mar-2021 04:00 EST Read more →

10 year T-Note up to 133.1644

March 9, 2021 11:17 am | By Autochartist

Falling Wedge has broken through the resistance line at 09-Mar-2021... Read more →

  • About Us
  • Privacy Policy
  • Disclaimer
  • Terms and Conditions
  • Get started for FREE
  • Contact Us
Copyright © 2020 Autochartist.com. All rights reserved.
This site uses cookies: Find out more.