Help & Documentation
  • Home
  • Sign In
  • Contact Us
  • Home
  • Sign In
  • Contact Us

Corn down to 338.0000

/Futures Technical Analysis - TD/Corn down to 338.0000

Corn down to 338.0000

Posted on March 26, 2020 by admin wrote in Futures Technical Analysis - TD.

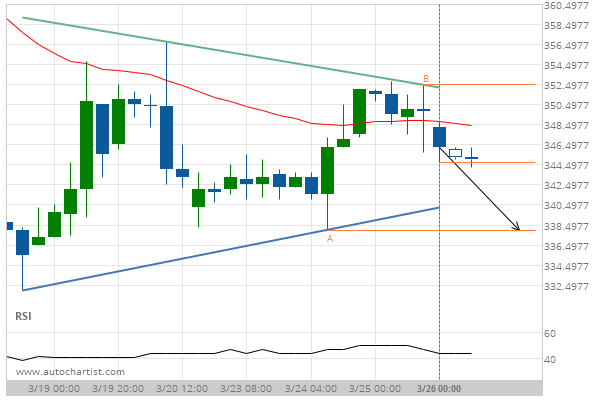
Pennant identified at 26-Mar-2020 00:00 EDT. This pattern is still in the process of forming. Possible bearish price movement towards the support 338.0000 within the next day.

Tags: CBOT, ZC
0 Likes
184 Views

You may also like

Corn down to 350.7500
September 14, 2018
Silver Front Month down to 16.9400
October 7, 2019
E-mini S&P 500 down to 3087.5000
June 5, 2020

Comments are closed.

Light Sweet Crude Oil Front Month down to 20.8000 Soybean Oil up to 27.0400

Futures Technical Analysis – TD

Soybean Meal up to 471.4000

January 18, 2021 11:16 am | By admin

Channel Up identified at 15-Jan-2021 12:00 EST. This pattern is... Read more →

Soybeans down to 1403.0000

January 18, 2021 11:16 am | By admin

Approaching Support level of 1403.0000 identified at 15-Jan-2021 12:30 EST Read more →

Gold Front Month down to 1800.8000

January 18, 2021 11:16 am | By admin

Channel Down identified at 18-Jan-2021 05:00 EST. This pattern is... Read more →

US T-Bond down to 168.0313

January 18, 2021 11:16 am | By admin

Triangle identified at 18-Jan-2021 05:00 EST. This pattern is still... Read more →

Corn down to 524.1489

January 18, 2021 11:16 am | By admin

Triangle has broken through the support line at 15-Jan-2021 09:00... Read more →

  • About Us
  • Privacy Policy
  • Disclaimer
  • Terms and Conditions
  • Get started for FREE
  • Contact Us
Copyright © 2020 Autochartist.com. All rights reserved.
This site uses cookies: Find out more.