Chevron Target Level: 119.10
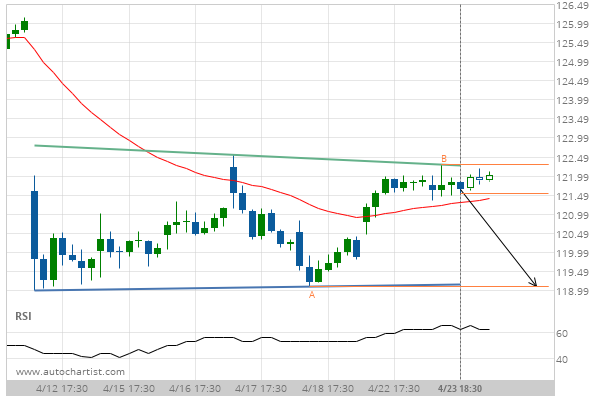
Descending Triangle identified at 23-Apr-2019 18:30 UTC. This pattern is still in the process of forming. Possible bearish price movement towards the support 119.10 within the next 12 hours.
Did you know that our social media feeds are updated only 3x per day, and don’t look at short term movements?
If you open a live account with a broker that support Autochartist, you’ll get:
Analysis as low as 15 minute data intervals Short term forecasts Risk and volatility information