Help & Documentation
  • Home
  • Sign In
  • Contact Us
  • Home
  • Sign In
  • Contact Us

Caterpillar Inc. (CAT) up to 149.23

/US Stocks Technical Analysis - TD/Caterpillar Inc. (CAT) up to 149.23

Caterpillar Inc. (CAT) up to 149.23

Posted on September 14, 2018 by admin wrote in US Stocks Technical Analysis - TD.

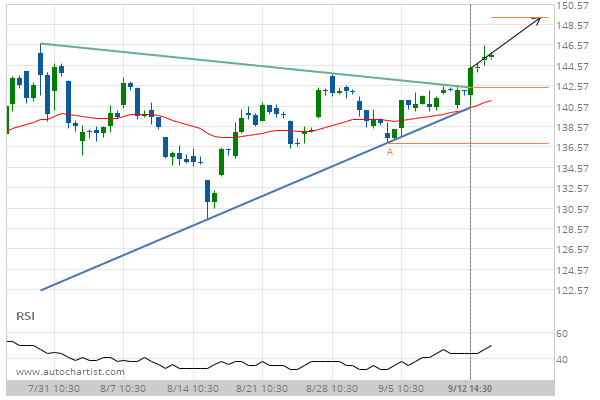
Triangle has broken through the resistance line at 12-Sep-2018 14:30 EDT. Possible bullish price movement forecast for the next 3 days towards 149.23.

Tags: CAT, Caterpillar Inc., NYSE
0 Likes
784 Views

You may also like

Exxon Mobil Corp. (XOM) down to 72.73
February 22, 2019
Chevron () up to 105.11
June 8, 2020
3m Co. () up to 168.11
August 31, 2020

Comments are closed.

Eurodollar (GE) down to 97.34 Home Depot Inc. (HD) excessive bearish movement

US Stocks Technical Analysis – TD

General Electric Co. () up to 11.57

January 21, 2021 1:06 pm | By admin

Approaching Resistance level of 11.57 identified at 21-Jan-2021 07:15 EST Read more →

3m Co. () up to 172.71

January 21, 2021 1:06 pm | By admin

Broke through Resistance level of 170.39 at 21-Jan-2021 07:30 EST Read more →

Merck & Co. Inc. (MRK) down to 80.09

January 21, 2021 1:06 pm | By admin

Descending Triangle identified at 20-Jan-2021 19:00 EST. This pattern is... Read more →

Exxon Mobil Corp. (XOM) down to 48.80

January 21, 2021 1:06 pm | By admin

Channel Up has broken through the support line at 21-Jan-2021... Read more →

Chevron () down to 94.39

January 21, 2021 1:06 pm | By admin

Approaching Support level of 94.39 identified at 21-Jan-2021 07:45 EST Read more →

  • About Us
  • Privacy Policy
  • Disclaimer
  • Terms and Conditions
  • Get started for FREE
  • Contact Us
Copyright © 2020 Autochartist.com. All rights reserved.
This site uses cookies: Find out more.