Help & Documentation
  • Home
  • Sign In
  • Contact Us
  • Home
  • Sign In
  • Contact Us

Boeing Co. (BA) down to 154.20

/US Stocks Technical Analysis - TD/Boeing Co. (BA) down to 154.20

Boeing Co. (BA) down to 154.20

Posted on October 16, 2020 by Autochartist wrote in US Stocks Technical Analysis - TD.

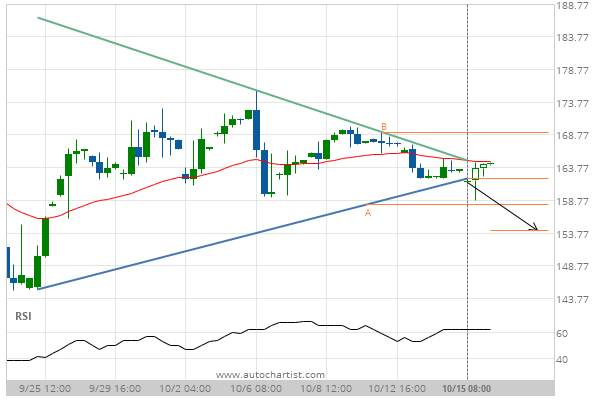
Triangle has broken through the support line at 15-Oct-2020 08:00 EDT. Possible bearish price movement forecast for the next 2 days towards 154.20.

Tags: BA, Boeing Co., NYSE
0 Likes
448 Views

You may also like

Chevron (CVX) up to 95.22
June 3, 2020
Nike Inc. Cl B (NKE) down to 100.82
January 15, 2020
Caterpillar Inc. (CAT) up to 132.10
February 12, 2019

Comments are closed.

Mcdonalds Corp. (MCD) excessive bullish movement General Electric Co. (GE) down to 6.42

US Stocks Technical Analysis – TD

Merck & Co. Inc. (MRK) up to 75.56

March 9, 2021 11:13 am | By Autochartist

Rising Wedge identified at 08-Mar-2021 19:30 EST. This pattern is... Read more →

Jpmorgan Chase & Co. (JPM) down to 147.97

March 9, 2021 11:13 am | By Autochartist

Channel Up identified at 08-Mar-2021 19:00 EST. This pattern is... Read more →

Visa (V) down to 215.41

March 9, 2021 11:13 am | By Autochartist

Triangle identified at 08-Mar-2021 20:00 EST. This pattern is still... Read more →

Home Depot Inc. (HD) down to 247.10

March 9, 2021 11:13 am | By Autochartist

Channel Down identified at 08-Mar-2021 16:00 EST. This pattern is... Read more →

Intel Corporation () down to 58.10

March 9, 2021 11:13 am | By Autochartist

Approaching Support level of 58.10 identified at 08-Mar-2021 16:00 EST Read more →

  • About Us
  • Privacy Policy
  • Disclaimer
  • Terms and Conditions
  • Get started for FREE
  • Contact Us
Copyright © 2022 Autochartist.com. All rights reserved.
This site uses cookies: Find out more.