Help & Documentation
  • Home
  • Sign In
  • Contact Us
  • Home
  • Sign In
  • Contact Us

Apple Inc. (AAPL) excessive bearish movement

/US Stocks Statistical Analysis - TD/Apple Inc. (AAPL) excessive bearish movement

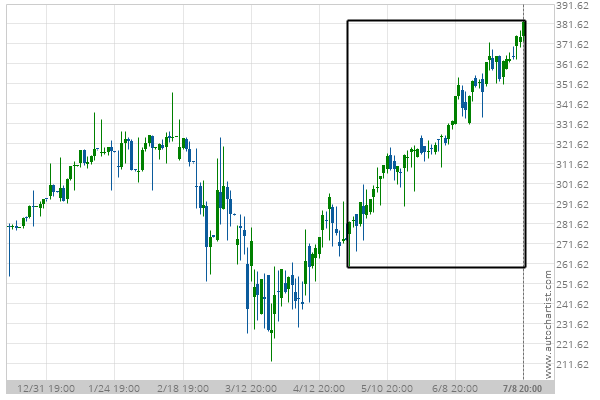
Apple Inc. (AAPL) excessive bearish movement

Posted on July 9, 2020 by Autochartist wrote in US Stocks Statistical Analysis - TD.

Apple Inc. experienced a 35.39% bullish movement in the last 76 days.

Tags: AAPL, Apple Inc.
0 Likes
498 Views

You may also like

Eurodollar (GE) excessive bearish movement
November 28, 2018
Pfizer Inc. (PFE) excessive bearish movement
January 31, 2020
Procter & Gamble Co. (PG) excessive bullish movement
December 5, 2019

Comments are closed.

Soybeans up to 894.0000 NZD/USD up to 0.6537

US Stocks Statistical Analysis – TD

Walt Disney (DIS) excessive bullish movement

March 9, 2021 11:16 am | By Autochartist

Walt Disney experienced 4 consecutive bullish candles. Possible bearish price... Read more →

Chevron (CVX) excessive bearish movement

March 9, 2021 11:16 am | By Autochartist

Chevron experienced a 27.28% bullish movement in the last 36... Read more →

Boeing Co. (BA) excessive bearish movement

March 8, 2021 11:19 am | By Autochartist

Boeing Co. experienced 3 consecutive bearish candles. Possible bullish price... Read more →

3m Co. (MMM) excessive bullish movement

March 8, 2021 11:19 am | By Autochartist

3m Co. experienced 5 consecutive bullish candles. Possible bearish price... Read more →

Verizon Communications Inc. (VZ) excessive bullish movement

March 8, 2021 11:19 am | By Autochartist

Verizon Communications Inc. experienced 4 consecutive bullish candles. Possible bearish... Read more →

  • About Us
  • Privacy Policy
  • Disclaimer
  • Terms and Conditions
  • Get started for FREE
  • Contact Us
Copyright © 2022 Autochartist.com. All rights reserved.
This site uses cookies: Find out more.