Help & Documentation
  • Home
  • Sign In
  • Contact Us
  • Home
  • Sign In
  • Contact Us

American Express Co. () up to 116.10

/US Stocks Technical Analysis - TD/American Express Co. () up to 116.10

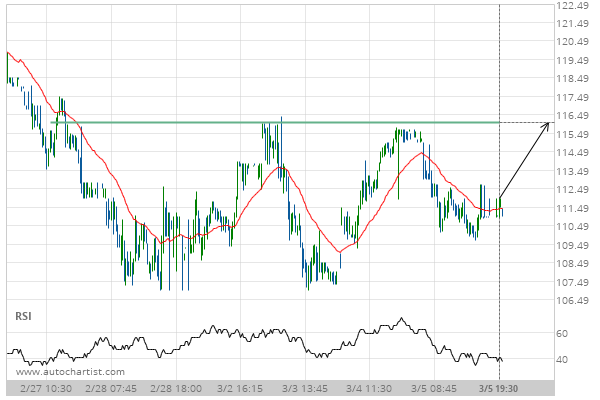
American Express Co. () up to 116.10

Posted on March 6, 2020 by Autochartist wrote in US Stocks Technical Analysis - TD.

Approaching Resistance level of 116.10 identified at 05-Mar-2020 19:30 EST

Tags: American Express Co., AXP
0 Likes
594 Views

You may also like

Jpmorgan Chase & Co. (JPM) up to 138.60
February 11, 2020
Jpmorgan Chase & Co. () up to 100.35
August 25, 2020
Procter & Gamble Co. (PG) up to 91.62
November 9, 2018

Comments are closed.

GBP/CHF down to 1.2134 Coca-Cola Co. (KO) up to 59.00

US Stocks Technical Analysis – TD

Merck & Co. Inc. (MRK) up to 75.56

March 9, 2021 11:13 am | By Autochartist

Rising Wedge identified at 08-Mar-2021 19:30 EST. This pattern is... Read more →

Jpmorgan Chase & Co. (JPM) down to 147.97

March 9, 2021 11:13 am | By Autochartist

Channel Up identified at 08-Mar-2021 19:00 EST. This pattern is... Read more →

Visa (V) down to 215.41

March 9, 2021 11:13 am | By Autochartist

Triangle identified at 08-Mar-2021 20:00 EST. This pattern is still... Read more →

Home Depot Inc. (HD) down to 247.10

March 9, 2021 11:13 am | By Autochartist

Channel Down identified at 08-Mar-2021 16:00 EST. This pattern is... Read more →

Intel Corporation () down to 58.10

March 9, 2021 11:13 am | By Autochartist

Approaching Support level of 58.10 identified at 08-Mar-2021 16:00 EST Read more →

  • About Us
  • Privacy Policy
  • Disclaimer
  • Terms and Conditions
  • Get started for FREE
  • Contact Us
Copyright © 2022 Autochartist.com. All rights reserved.
This site uses cookies: Find out more.