Trade of the Day: NZD/CAD
By: Dima Chernovolov
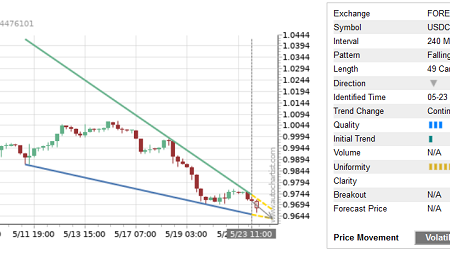
NZD/CAD continues to fall inside the daily Up Channel chart pattern which was previously identified by Autochartist. Autochartist rates the quality of this Up Channel at the 5-bar level – which is the result of the above-average Initial Trend (7 bars), low Uniformity (1 bar) and strong Clarity (7 bars). NZD/CAD is expected to fall further inside this chart pattern – in line with the earlier downward reversal from the key resistance area shown below.

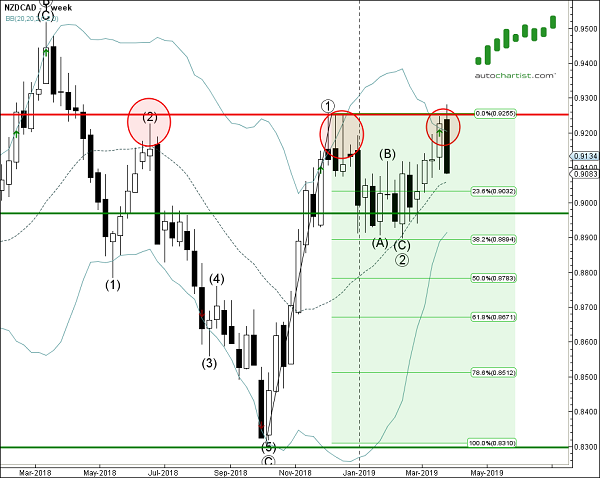
As can be seen from the weekly NZD/CAD below, the top of this Up Channel formed when the price earlier down from the key resistance area lying between the long-term resistance level 0.9250 (which has been reversing the price from last May) and the upper weekly Bollinger Band. The proximity of this resistance area increases the probability NZD/CAD will continue to fall inside this Up Channel.