Trade of the Day: USD/CHF
By: Dima Chernovolov
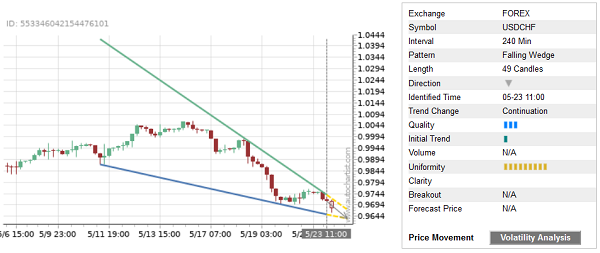
USD/CHF continues to fall inside the clear 4-hour Falling Wedge chart pattern, which was recently identified by Autochartist. Autochartist rates the quality of this Falling Wedge at the 3-bar level – which reflects the slow Initial Trend (1 bar) and strong Uniformity (9 bars). USD/CHF is expected to fall further inside this Falling Wedge .
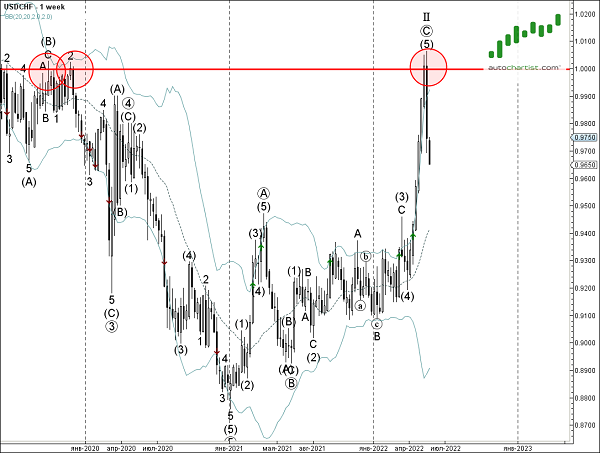
As can be seen from the weekly USD/CHF chart below – the price earlier reversed down with the weekly Bearish Engulfing candlesticks pattern from the key resistance zone located between the parity, 1.0000 (which has been reversing USD/CHF from the end of 2019) and the upper weekly Bollinger Band. The proximity of this resistance zone increases the probability USD/CHF will continue to fall inside this Falling Wedge .