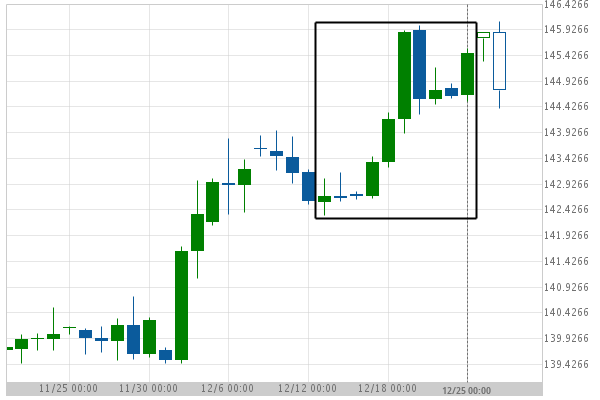
US T-Bond excessive bearish movement Posted on December 27, 2018 by Autochartist wrote in Futures Statistical Analysis - TD. US T-Bond experienced a 2.04% bullish movement in the last 12 days. Tags: Big Movement, ZB 0 Likes 1076 Views You may also like Light Sweet Crude Oil Front Month excessive bearish movement October 26, 2020 KC HRW Wheat excessive bearish movement July 8, 2019 Silver Front Month excessive bearish movement March 17, 2020 Comments are closed.