Trade of the Day: EUR/NZD
By: Dima Chernovolov
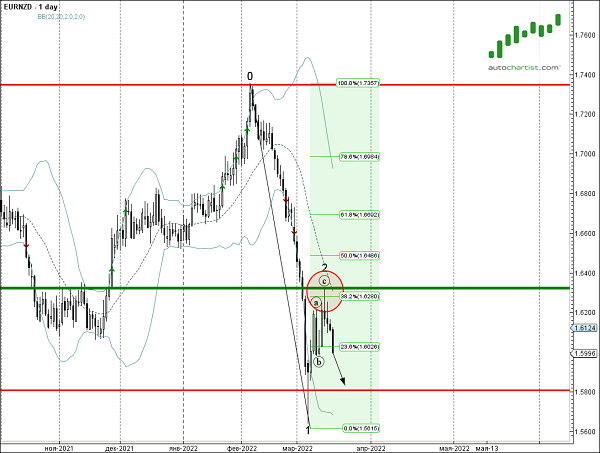
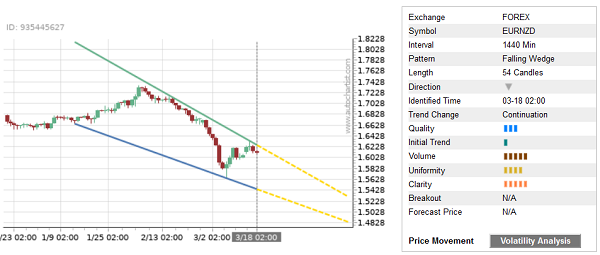
EUR/NZD continues to fall inside the daily Falling Wedge chart pattern, which was recently identified by Autochartist. Autochartist rates the quality of this Falling Wedge at the 3-bar level – which is the result of the slow Initial Trend (1 bar), below-average Uniformity (4 bars) and medium Clarity (5 bars). EUR/NZD is expected to fall further inside this Falling Wedge .
As can be seen from the daily EUR/NZD chart below – the price earlier reversed down from the resistance area located between the key resistance level 1.6325, 20-day moving average and the 38.2% Fibonacci correction of the downward impulse from February. The proximity of this resistance zone adds to the probability EUR/NZD will continue to fall inside this Falling Wedge .