Trade of the Day: NZD/USD
By: Dima Chernovolov
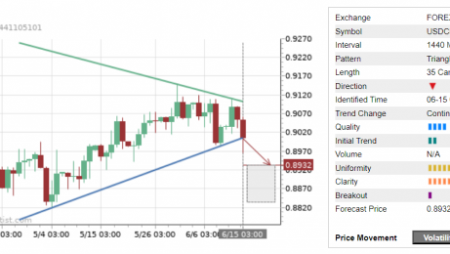
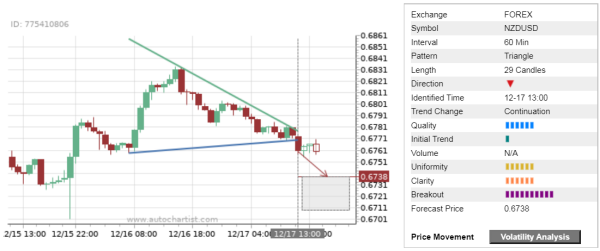
NZD/USD recently broke the hourly Triangle chart pattern, which was recently identified by Autochartist. Autochartist rates the quality of this Triangle at the 6-bar level – which is the result of the slow Initial Trend (1 bar) and above-average Uniformity and Clarity (6 bars). NZD/USD is expected to fall toward the forecast price 0.6738.
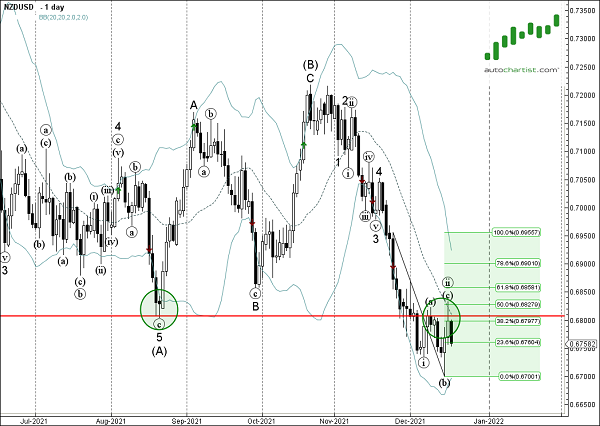
As can be seen from the daily NZD/USD chart below – the price earlier reversed down from the resistance zone lying between the key resistance level 0.6800 (former multi-month support from August) and the 20-day moving average. The proximity of this resistance area adds to the probability NZD/USD will continue to fall toward the forecast price 0.6738.