Help & Documentation
  • Home
  • Sign In
  • Contact Us
  • Home
  • Sign In
  • Contact Us

3m Co. (MMM) up to 156.69

/US Stocks Technical Analysis - TD/3m Co. (MMM) up to 156.69

3m Co. (MMM) up to 156.69

Posted on April 28, 2020 by Autochartist wrote in US Stocks Technical Analysis - TD.

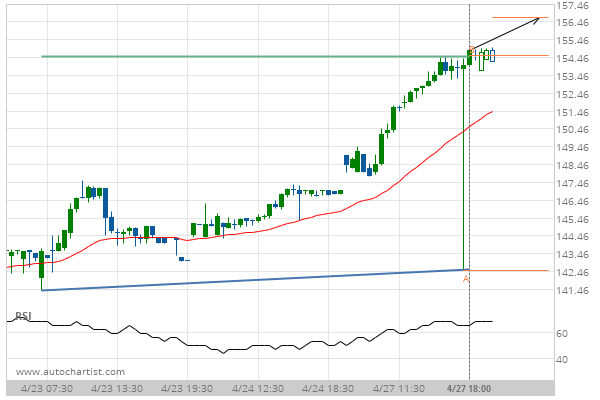
Double Bottom has broken through the resistance line at 27-Apr-2020 18:00 EDT. Possible bullish price movement forecast for the next 10 hours towards 156.69.

Tags: 3m Co., MMM, NYSE
0 Likes
572 Views

You may also like

DowDuPont (DWDP) up to 60.70
October 17, 2018
General Electric Co. () up to 10.39
June 7, 2019
Nike Inc. Cl B (NKE) up to 89.86
April 25, 2019

Comments are closed.

American Express Co. (AXP) up to 97.85 Merck & Co. Inc. () up to 86.01

US Stocks Technical Analysis – TD

Merck & Co. Inc. (MRK) up to 75.56

March 9, 2021 11:13 am | By Autochartist

Rising Wedge identified at 08-Mar-2021 19:30 EST. This pattern is... Read more →

Jpmorgan Chase & Co. (JPM) down to 147.97

March 9, 2021 11:13 am | By Autochartist

Channel Up identified at 08-Mar-2021 19:00 EST. This pattern is... Read more →

Visa (V) down to 215.41

March 9, 2021 11:13 am | By Autochartist

Triangle identified at 08-Mar-2021 20:00 EST. This pattern is still... Read more →

Home Depot Inc. (HD) down to 247.10

March 9, 2021 11:13 am | By Autochartist

Channel Down identified at 08-Mar-2021 16:00 EST. This pattern is... Read more →

Intel Corporation () down to 58.10

March 9, 2021 11:13 am | By Autochartist

Approaching Support level of 58.10 identified at 08-Mar-2021 16:00 EST Read more →

  • About Us
  • Privacy Policy
  • Disclaimer
  • Terms and Conditions
  • Get started for FREE
  • Contact Us
Copyright © 2022 Autochartist.com. All rights reserved.
This site uses cookies: Find out more.